QT5.5.1+QwtPlot绘制二维坐标图
前言:要求必须配置有QwtPlot,否则提供的代码无法正常运行。
1.基于QwtPlot编写新的函数类PlotLines,代码如下:
h文件
#ifndef PLOTLINES_H
#define PLOTLINES_H
#include
#include
#include
#include
#include
#include
#include
#include
#include
#include
#include
#include
#include
#include
#include
#include
#include
#include

using namespace  std;


class PlotLines : public QwtPlot
{
    Q_OBJECT
public:
    explicit PlotLines(QWidget *parent = 0);
    void fucSetLineMsg(int num,vector lineData,vector lineName);
    void fucUpdate();
    void fucSetTitle(QString in) {this->setTitle(in);}
    void fucSetSize(int width,int height) {this->resize(width,height);}
private Q_SLOTS:
    //点击图例,显示相应的曲线
    void showItem(const QVariant &itemInfo, bool on);
private:
    void fucInit();
    void fucInitVec();
    int gloLineNum;
    vector gloLineData;
    vector gloLine;
    vector gloLineName;
    vector gloColor;
    QwtLegend *legend;
};

#endif // PLOTLINES_H
cpp文件
#pragma execution_character_set("utf-8")
#include "plotlines.h"

PlotLines::PlotLines(QWidget *parent) :
    QwtPlot(parent)
{
    legend = new QwtLegend;
    fucInitVec();
    fucInit();
    fucUpdate();
}
//点击图例,显示相应的曲线
void PlotLines::showItem(const QVariant &itemInfo, bool on)
{
    QwtPlotItem *plotItem = infoToItem( itemInfo );
    if ( plotItem )
        plotItem->setVisible( on );
}
void PlotLines::fucSetLineMsg(int num,vector lineData,vector lineName)
{
    foreach (QwtPlotCurve *i, gloLine)
    {
        i->detach();
    }
    gloLineNum=int(lineData.size());
    gloLineData=lineData;gloLine.clear();gloLineName=lineName;
    int flagTemp=gloLineName.empty();
    if(gloLine.empty() || gloLine.size()!=gloLineNum)
    {
        gloLine.clear();
    for(int i=0;isetPen(gloColor[i%7],2);//设置曲线颜色 粗细
        curve->setRenderHint(QwtPlotItem::RenderAntialiased,true);//线条光滑化
        QwtSymbol *symbol = new QwtSymbol( QwtSymbol::Ellipse,
                                           QBrush( Qt::black ), QPen( gloColor[i%7], 2 ), QSize( 6, 6) );//设置样本点的颜色、大小
        curve->setSymbol( symbol );//添加样本点形状
        curve->setSamples(gloLineData[i]);
        curve->attach( this );
        curve->setLegendAttribute(curve->LegendShowLine);
        gloLine.push_back(curve);
    }
    }
    else
    {
        for(int i=0;isetSamples(gloLineData[i]);
        }
    }
}
void PlotLines::fucUpdate()
{
    this->replot();
    setAutoReplot();
    //获取画了多少条曲线,如果为获取其他形状,注意改变参数
    QwtPlotItemList items = itemList( QwtPlotItem::Rtti_PlotCurve );
    for ( int i = 0; i < items.size(); i++ )
    {


        {
            const QVariant itemInfo = itemToInfo( items[i] );
            QwtLegendLabel *legendLabel =
                    qobject_cast( legend->legendWidget( itemInfo ) );
            if ( legendLabel )
                legendLabel->setChecked( true );//
        }
    }

}
void PlotLines::fucInit()
{
    //---------设置画布---------//
    QwtPlotCanvas *canvas=new QwtPlotCanvas();
    canvas->setPalette(Qt::white);
    canvas->setBorderRadius(10);
    setCanvas( canvas );
    plotLayout()->setAlignCanvasToScales( true );

    //-----------设置x,y坐标和范围--------------//
    setAxisTitle( QwtPlot::yLeft, "y轴" );
    setAxisTitle( QwtPlot::xBottom, "x轴" );
    //----------------设置栅格线-------------------//
    QwtPlotGrid *grid = new QwtPlotGrid;
    grid->enableX( true );//设置网格线
    grid->enableY( true );
    grid->setMajorPen( Qt::black, 0, Qt::DotLine );
    grid->attach( this );
    //--------------设置图例可以被点击来确定是否显示曲线-----------------------//

    legend->setDefaultItemMode( QwtLegendData::Checkable );//图例可被点击
    insertLegend( legend, QwtPlot::RightLegend );
    connect( legend, SIGNAL( checked( const QVariant &, bool, int ) ),
             SLOT( showItem( const QVariant &, bool ) ) );//点击图例操作

    QwtPlotItemList items = itemList( QwtPlotItem::Rtti_PlotCurve );//获取画了多少条曲线,如果为获取其他形状,注意改变参数
    //  qDebug()<( legend->legendWidget( itemInfo ) );
            if ( legendLabel )
                legendLabel->setChecked( true );//

            items[i]->setVisible( true );
        }
        else
        {
            items[i]->setVisible( false );
        }
    }

}
void PlotLines::fucInitVec()
{
    gloColor.push_back(QColor(255,0,0));
    gloColor.push_back(QColor(255,128,0));
    gloColor.push_back(QColor(255,255,0));
    gloColor.push_back(QColor(0,255,0));
    gloColor.push_back(QColor(0,0,255));
    gloColor.push_back(QColor(0,255,255));
    gloColor.push_back(QColor(128,0,255));
}
2.PlotLines是基于QwtPlot生成的新的方法类,其公共函数接口作用如下:
(1)PlotLines(QWidget *parent = 0);构造函数,父控件可为空,也可为具体界面;
(2)fucSetTitle设定显示出的坐标图的名称;
(3)fucSetSize设定坐标图的长宽尺寸(移动显示位置可以使用基于QwtPlot的move函数);
(4)fucSetLineMsg(int num,vector
QPolygonF in;
in<
(5)fucUpdate();曲线重画方法,调用(4)函数更新数据点后,必须调用该方法才能刷新界面显示。
3,最终的使用效果如下

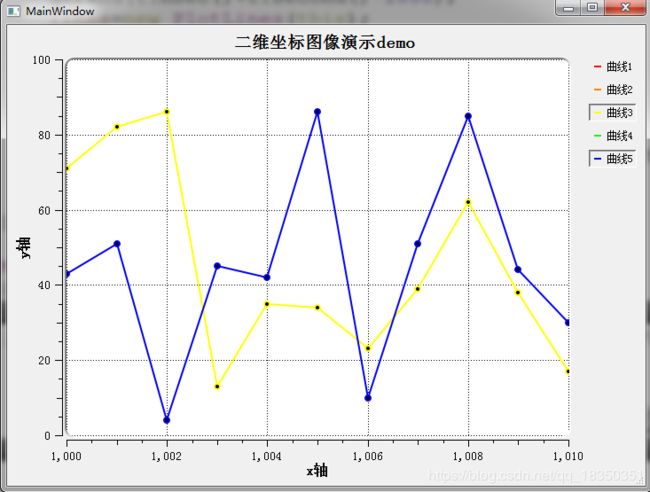
通过点击图示,可以进行折线的显示与隐藏。
注意:
(1)笔者只设定了七种颜色的线条颜色,当涉及到7以上的线条时,重复这七种颜色;
(2)动态画图也很简单,写一个定时器,更新lineData数据,调用fucSetLineMsg()及fucUpdate两个方法即可。