python数据分析_kaggle电影数据分析案例
#导入需要的包
import pandas as pd
import numpy as np
import matplotlib.pyplot as plt
import json
#导入数据
movies=pd.read_csv(r'E:\python\data\tmdb_5000_movies.csv',sep=',')
credit=pd.read_csv(r'e:\python\data\tmdb_5000_credits.csv',sep=',')#检查两个id列和title列是否真的相同
(movies['id']==credit['movie_id']).describe()结果为:
count 4803
unique 1
top True
freq 4803
dtype: object
(movies['title']==credit['title']).describe()结果为:
count 4803
unique 1
top True
freq 4803
Name: title, dtype: object
#删除多余列
del credit['movie_id']
del credit['title']
del movies['homepage']
del movies['spoken_languages']
del movies['original_language']
del movies['original_title']
del movies['overview']
del movies['tagline']
del movies['status']
#合并两个数据集
full_df=pd.concat([credit,movies],axis=1)#横向连接#缺失值处理,首先找到缺失值,然后对其进行处理
nan_x=full_df['runtime'].isnull()
full_df.loc[nan_x,:]#在网上查询对应的信息,并填进去
full_df.loc[2656,'runtime']=98
full_df.loc[4140,'runtime']=82#release_date字段的缺失值同样处理
nan_y=full_df['release_date'].isnull()
full_df.loc[nan_y,:]#同样在网上找到对应的信息,并填进去
full_df.loc[4553,'release_date']='2014-06-01'#将release_date的类型转换成日期类型
full_df['release_date']=pd.to_datetime(full_df['release_date'],errors='coerce',format='%Y-%m-%d')
full_df.info()结果为:
RangeIndex: 4803 entries, 0 to 4802
Data columns (total 15 columns):
cast                    4803 non-null object
crew                    4803 non-null object
budget                  4803 non-null int64
genres                  4803 non-null object
id                      4803 non-null int64
keywords                4803 non-null object
popularity              4803 non-null float64
production_companies    4803 non-null object
production_countries    4803 non-null object
release_date            4803 non-null datetime64[ns]
revenue                 4803 non-null int64
runtime                 4803 non-null float64
title                   4803 non-null object
vote_average            4803 non-null float64
vote_count              4803 non-null int64
dtypes: datetime64[ns](1), float64(3), int64(4), object(7)
memory usage: 562.9+ KB
#转换成日期格式后,提取对应的年份
full_df['release_year']=full_df['release_date'].map(lambda x : x.year)
full_df.loc[:,'release_year'].head()
结果为:
0 2009
1 2007
2 2015
3 2012
4 2012
Name: release_year, dtype: int64
#提取json格式
#使用json.loads将json格式转化成字符串
json_cols=['genres','keywords','production_companies','production_countries','cast','crew']
for i in json_cols:
    full_df[i]=full_df[i].apply(json.loads)
#用join方法将所有类型汇总
def get_names(x):
    return ','.join(i['name'] for i in x)

full_df['genres']=full_df['genres'].apply(get_names)
full_df['keywords']=full_df['keywords'].apply(get_names)
full_df['production_companies']=full_df['production_companies'].apply(get_names)
full_df['production_countries']=full_df['production_countries'].apply(get_names)full_df['genres'].head()结果为:
0    Action,Adventure,Fantasy,Science Fiction
1                    Adventure,Fantasy,Action
2                      Action,Adventure,Crime
3                 Action,Crime,Drama,Thriller
4            Action,Adventure,Science Fiction
Name: genres, dtype: object
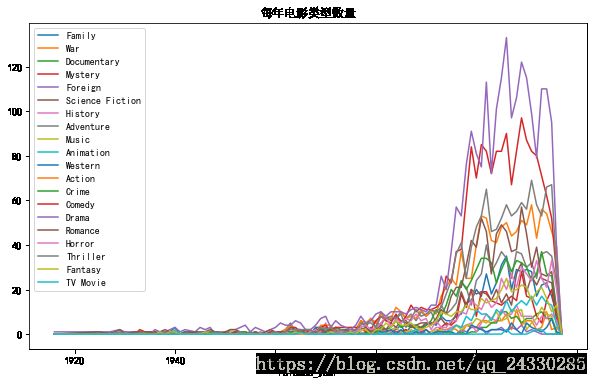
#电影类型随时间变化
#获取所有电影类型
real_genres=set()
for i in full_df['genres'].str.split(','):
    real_genres=real_genres.union(i)
real_genres=list(real_genres)#将集合转换成列表
real_genres.remove('')#删除空格
print(real_genres)
结果为:
[‘Horror’, ‘Documentary’, ‘War’, ‘Animation’, ‘Western’, ‘Mystery’, ‘Adventure’, ‘Romance’, ‘Comedy’, ‘Music’, ‘Drama’, ‘Family’, ‘Foreign’, ‘Science Fiction’, ‘TV Movie’, ‘Action’, ‘Crime’, ‘History’, ‘Thriller’, ‘Fantasy’]
#将所有类型添加到列表
for i in real_genres:
    full_df[i]=full_df['genres'].str.contains(i).apply(lambda x:1 if x else 0)
full_df.head(2)
#获取年份和类型子集
part1_df=full_df[['release_year', 'Family', 'War', 'Documentary', 'Mystery', 'Foreign','Science Fiction', 'History', 'Adventure', 'Music', 'Animation',
'Western', 'Action', 'Crime', 'Comedy', 'Drama', 'Romance', 'Horror','Thriller', 'Fantasy', 'TV Movie']]
#按年分组统计每年各类型电影数量
year_cnt=part1_df.groupby('release_year').sum()
year_cnt.tail()#绘图
plt.figure(figsize=(10,6))
plt.rc('font',family='SimHei',size=10)#设置字体和大小,否则中文无法显示
ax1=plt.subplot(1,1,1)
year_cnt.plot(kind='line',ax=ax1)
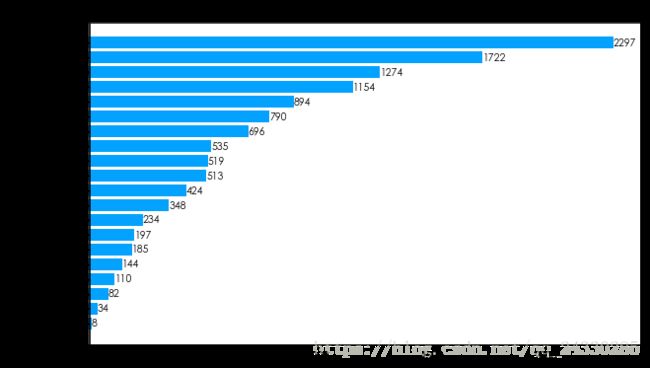
plt.title('每年电影类型数量')#不同电影类型总数量
genre=year_cnt.sum(axis=0)#对列求和
genre=genre.sort_values(ascending=True)
genre结果为:
TV Movie 8
Foreign 34
Western 82
Documentary 110
War 144
Music 185
History 197
Animation 234
Mystery 348
Fantasy 424
Family 513
Horror 519
Science Fiction 535
Crime 696
Adventure 790
Romance 894
Action 1154
Thriller 1274
Comedy 1722
Drama 2297
dtype: int64
#对上面的数据绘制横向条形图
plt.figure(figsize=(10,6))
plt.rc('font',family='STXihei',size=10.5)
ax2=plt.subplot(1,1,1)
label=list(genre.index)
data=genre.values
rect=ax2.barh(range(len(label)),data,color='#03A2FF',alpha=1)
ax2.set_title('不同电影类型数量')#设置标题
ax2.set_yticks(range(len(label)))
ax2.set_yticklabels(label)
#添加数据标签
for x,y in zip(data,range(len(label))):
    ax2.text(x,y,'{}'.format(x),ha='left',va='center')
#计算不同类型电影收入(亿元)
r={}
for i in real_genres:
r[i]=full_df.loc[full_df[i]==1,'revenue'].sum(axis=0)/100000000
revenue=pd.Series(r).sort_values(ascending=True)
revenue结果为:
TV Movie              0.000000
Foreign               0.123982
Documentary          10.822777
Western              37.921691
Music                89.643511
History             113.321417
War                 121.184459
Horror              225.998947
Mystery             272.487228
Crime               460.408607
Animation           528.121679
Romance             536.421375
Science Fiction     815.642357
Fantasy             819.821999
Family              832.832387
Thriller           1032.504263
Drama              1197.109840
Comedy             1227.605176
Action             1629.599145
Adventure          1648.415616
dtype: float64
#对上面的结果绘制横向条形图
plt.figure(figsize=(12,6))
plt.rc('font',family='Simhei',size=10.5)
ax=plt.subplot(1,1,1)
label=revenue.index
data=revenue.values
ax.barh(range(len(label)),data,color='#03A2FF',alpha=1)
ax.set_yticks(range(len(label)))#设置y轴刻度
ax.set_yticklabels(label)#设置刻度名称
ax.set_title('不同类型电影收入')
#添加数据标签
for x,y in zip(data,range(len(label))):
    ax.text(x,y,'{:.1f}'.format(x))#坐标位置,及要显示的文字内容
#票房收入影响因素分析
corr=full_df.corr()#计算各变量间的相关系数矩阵
corr_revenue=corr['revenue'].sort_values(ascending=False)#提取收入与其他变量间的相关系数,并从大到小排序
corr_revenue.head(10)结果为:
revenue 1.000000
vote_count 0.781487
budget 0.730823
popularity 0.644724
Adventure 0.344400
runtime 0.251201
Fantasy 0.212287
Action 0.203590
Animation 0.199335
vote_average 0.197150
Name: revenue, dtype: float64
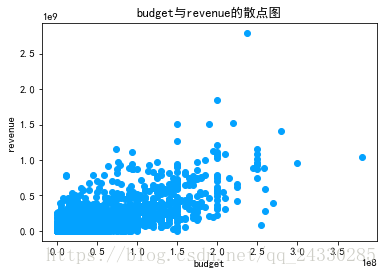
#可以看到,在电影上映前,不会有vote_count, popularity 的数据,因此可以看到相关性最高的就是budget预算(成本)
#绘制散点图,分析budget与revenue的相关性
x=full_df.loc[:,'budget']
y=full_df.loc[:,'revenue']
plt.rc('font',family='SimHei',size=10.5)
plt.scatter(x,y,color='#03A2FF')
plt.xlabel('budget')
plt.ylabel('revenue')
plt.title('budget与revenue的散点图')
plt.show()
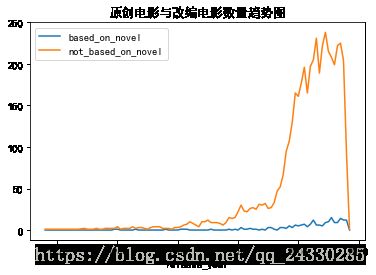
#原创电影与改编电影分析
part2_df=full_df.loc[:,['release_year','keywords']]
part2_df['based_on_novel']=part2_df['keywords'].str.contains('based on novel').apply(lambda x:1 if x else 0)
part2_df['not_based_on_novel']=part2_df['keywords'].str.contains('based on novel').apply(lambda x:0 if x else 1)
part2_df.head()| release_year | keywords | based_on_novel | not_based_on_novel | |
|---|---|---|---|---|
| 0 | 2009 | culture clash,future,space war,space colony,so… | 0 | 1 |
| 1 | 2007 | ocean,drug abuse,exotic island,east india trad… | 0 | 1 |
| 2 | 2015 | spy,based on novel,secret agent,sequel,mi6,bri… | 1 | 0 |
| 3 | 2012 | dc comics,crime fighter,terrorist,secret ident… | 0 | 1 |
| 4 | 2012 | based on novel,mars,medallion,space travel,pri… | 1 | 0 |
novel_per_year=part2_df.groupby('release_year')['based_on_novel','not_based_on_novel'].sum(axis=0)
novel_per_year.tail()| based_on_novel | not_based_on_novel | |
|---|---|---|
| release_year | ||
| 2013 | 9 | 222 |
| 2014 | 14 | 225 |
| 2015 | 12 | 204 |
| 2016 | 12 | 92 |
| 2017 | 0 | 1 |
#对上面结果绘制折线图
novel_per_year.plot()
plt.rc('font',family='SimHei',size=10.5)
plt.title('原创电影与改编电影数量趋势图')
Text(0.5,1,'原创电影与改编电影数量趋势图')
#原创电影与改编电影总数
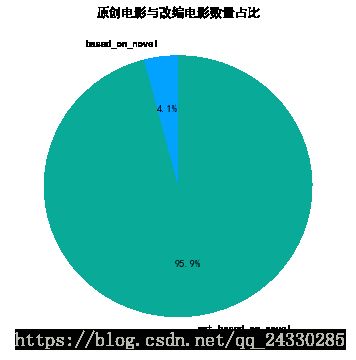
novel_all=[part2_df['based_on_novel'].sum(axis=0),part2_df['not_based_on_novel'].sum(axis=0)]
novel_rate=novel_all/sum(novel_all)
novel_rate
array([0.04101603, 0.95898397])
#对上面结果绘制饼图
plt.figure(figsize=(6,6))
plt.rc('font',family='SimHei',size=10.5)
ax=plt.subplot(111)#与plt.sumplot(1,1,1)效果一样
labels=['based_on_novel','not_based_on_novel']
colors=['#03A2FF','#0AAA99']
ax.pie(novel_rate,labels=labels,colors=colors,startangle=90,autopct='%1.1f%%')
ax.set_title('原创电影与改编电影数量占比')
Text(0.5,1,'原创电影与改编电影数量占比')
#获取所有关键词及其对应词频
keywords_dic={}
def get_keywords(x):
    for i in x:
        keywords_dic[i]=keywords_dic.get(i,0)+1

full_df['keywords'].str.split(',').apply(get_keywords)

#绘制词云
import imageio
import matplotlib.pyplot as plt
from wordcloud import WordCloud,STOPWORDS
import pandas as pd

bg_img=imageio.imread(r'E:\python\image\img4.jpg') #读取图片
wordcloud=WordCloud(mask=bg_img #以该参数值作图绘制词云,这个参数不为空时,width和height会被忽略
                    ,max_words=500 #最大词数
                    ,font_path="simhei.ttf" #自定义字体
                    ,background_color="white" #背景颜色
                    ,max_font_size=80 #最大字号
                    ,prefer_horizontal=100 #词语水平方向排版出现的频率,设置为100表示全部水平显示
                    ,stopwords=STOPWORDS #使用屏蔽词
                    )
wordcloud=wordcloud.fit_words(keywords_dic)
plt.imshow(wordcloud)
plt.axis('off')
plt.show()
wordcloud.to_file('E:\\python\\image\\test.jpg')
#统计各个国家的电影数
part3_df=full_df[['production_countries','id','release_year']]#提取需要的列子集
#由于有的电影产地属于多个国家,故需要对production_countries进行分列
split_df=pd.DataFrame([x.split(',') for x in part3_df['production_countries']],index=part3_df.index)
#将分列后的数据集与源数据集合并
part3_df=pd.merge(part3_df,split_df,left_index=True,right_index=True)
#下面代码实现列转行
st_df=part3_df[['release_year',0,1,2,3]]
st_df=st_df.set_index('release_year')
st_df=st_df.stack()
st_df=st_df.reset_index()

st_df=st_df.rename(columns={0:'production_countries'})#对列重命名
countries=st_df['production_countries'].value_counts()#统计各个国家的电影数
countries.sum()
countries_rate=countries/countries.sum()#计算占比
countries_top5=countries_rate.head(5)
other={'other':1-countries_top5.sum()}
countries_top6=countries_top5.append(pd.Series(other))
countries_top6
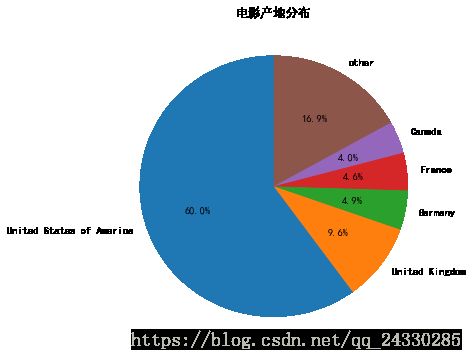
United States of America 0.600244
United Kingdom 0.095978
Germany 0.048751
France 0.046466
Canada 0.039610
other 0.168952
dtype: float64
#对上面结果绘制饼图
labels=list(countries_top6.index)
plt.figure(figsize=(6,6))
plt.rc('font',family='SimHei',size=10.5)
ax=plt.subplot(1,1,1)
ax.pie(countries_top6,labels=labels,startangle=90,autopct='%1.1f%%')
ax.set_title('电影产地分布')
Text(0.5,1,'电影产地分布')
#统计各个电影公司电影数
part4_df=full_df[['production_companies','release_year']]
split_df=pd.DataFrame([x.split(',') for x in part4_df['production_companies']],index=part4_df.index)
part4_df=pd.merge(part4_df,split_df,left_index=True,right_index=True)
del part4_df['production_companies']
part4_df=part4_df.set_index('release_year')
part4_df=part4_df.stack()
part4_df=part4_df.reset_index()
part4_df=part4_df.rename(columns={0:'production_companies'})
companies=part4_df['production_companies'].value_counts()
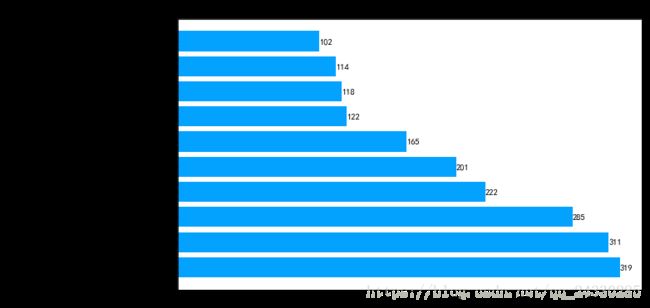
companies_top10=companies[companies.index!=''].head(10)
#绘制横向条形图
plt.figure(figsize=(10,6))
plt.rc('font',family='SimHei',size=10.5)
ax=plt.subplot(111)
ax.barh(range(10),companies_top10.values,color='#03A2FF')
ax.set_title('电影公司top10')
ax.set_yticks(range(10))
ax.set_yticklabels(companies_top10.index)
for x,y in zip(companies_top10.values,range(10)):
    ax.text(x,y,'{}'.format(x),ha='left',va='center')

