Unity自定义UI组件(一)函数图篇(上)
Untiy自定义UI组件
==转载标明出处==
MaskableGraphic(可遮罩图形):
MaskableGraphic是Unity中多种UI组件的父类,比如Image、Text等。Untiy官网中关于MaskableGraphic的介绍只有一句:
A Graphic that is capable of being masked out.
一个可以遮盖的图形
1.关键属性maskable,当它等于false代表不可遮掩,等于true代表可以被其他组件遮盖。
2.关键方法OnPopulateMesh,在继承了MaskableGraphic的子类中重写该方法,向OnPopulateMesh方法中传入对应的VertexHelper类型(5.0以前的版本4.X是传入Mesh类型)的数据,即可构建出自己想要的组件。
3.VertexHelper是一个包含了网格数据中的顶点数据和三角面对应顶点的序号,不了解网格数据的同鞋可以去查看一下Mesh类型后者查看我的其他网格类型博文。
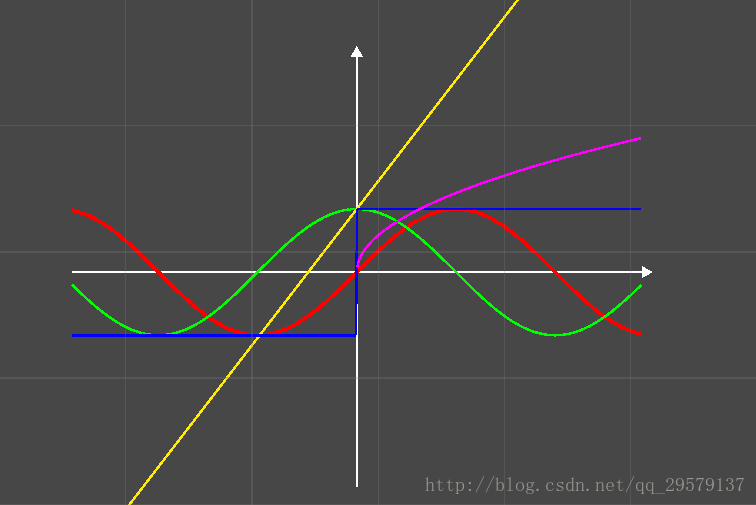
一个简单例子:在XY坐标轴绘制函数图
实现逻辑:
1.定义XY轴和箭头常量
1.1先定义一下XY轴的一些常量,写在一个单独的类中并序列化,这样可以在Inspector面板上显示常量并方便调节常量。
//序列化该类型
[Serializable]
public class FunctionalGraphBase
{
    ///
    /// 是否显示X轴
    ///
    public bool ShowXAxis = true;
    ///
    /// 是否显示Y轴
    ///
    public bool ShowYAxis = true;
    ///
    /// 是否显示刻度
    ///
    public bool ShowScale = false;
    ///
    /// 是否显示XY轴单位
    ///
    public bool ShowXYAxisUnit = true;
    ///
    /// X轴单位
    ///
    public string XAxisUnit = "X";
    ///
    /// Y轴单位
    ///
    public string YAxisUnit = "Y";
    ///
    /// XY轴刻度
    ///
    [Range(0.1f,100f)]public float XYAxisScale = 50f;
    ///
    /// XY轴宽度
    ///
    [Range(0.1f , 100f)]public float XYAxisWidth = 5.0f;
    ///
    /// XY轴颜色
    ///
    public Color XYAxisColor = Color.gray;
    ///
    /// 是否显示XY轴的箭头
    ///
    public bool ShowXYAxisArrow = true;
    ///
    /// 箭头尺寸
    ///
    public float ArrowSzie = 3.0f;
}
2.定义函数表达式常量
2.1 定义一个函数公式类型,Func委托是可以输出零到多个参数,并必须有一个返回值的委托类型,第一个float代表输入x值,返回值代表y值
比如:
Mathf.Sin : y = Mathf.Sin(x);
Mathf.Cos : y = Mathf.Cos(x);
直线函数 : y = 2*x + 3;
2.2 类型中定义改函数图的另外两个属性,一个是线条颜色,一个是线条宽度
public class FunctionFormula
{
    ///
    /// 函数表达式
    ///
    public Func Formula;
    ///
    /// 函数图对应线条颜色
    ///
    public Color FormulaColor;
    public float FormulaWidth;

    public FunctionFormula(){}
    public FunctionFormula( Func formula ,Color formulaColor ,float width )
    {
        Formula = formula;
        FormulaColor = formulaColor;
        FormulaWidth = width;
    }
}
3.绘制
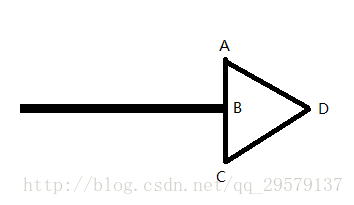
箭头绘制原理图:
public class FunctionalGraph : MaskableGraphic
{
    public FunctionalGraphBase GraphBase = new FunctionalGraphBase();
    public List Formulas = new List();
    private RectTransform _myRect;

    ///
    /// 初始化函数信息,添加了五个函数公式
    ///
    private void Init()
    {
        _myRect = this.rectTransform;
        Formulas.Add(new FunctionFormula(Mathf.Sin , Color.red , 3.0f));
        Formulas.Add(new FunctionFormula(Mathf.Cos , Color.green , 2.0f));
        Formulas.Add(new FunctionFormula(Mathf.Sign , Color.blue , 2.0f));
        Formulas.Add(new FunctionFormula(Mathf.Sqrt , Color.magenta , 2.0f));
        Formulas.Add(new FunctionFormula(xValue => xValue * 1.3f + 1 , Color.yellow , 2.0f));
    }

    ///
    /// 重写这个类以绘制UI,首先初始化数据和清空已有的顶点数据
    ///
    ///
    protected override void OnPopulateMesh(VertexHelper vh)
    {
        Init();
        vh.Clear();

        #region 基础框架的绘制

        //绘制X轴,获取X轴左右两个顶点,绘制一个矩形
        if (GraphBase.ShowXAxis)
        {
            float lenght = _myRect.sizeDelta.x;
            Vector2 leftPoint = new Vector2(-lenght / 2.0f , 0);
            Vector2 rightPoint = new Vector2(lenght / 2.0f , 0);
            vh.AddUIVertexQuad(GetQuad(leftPoint , rightPoint , GraphBase.XYAxisColor , GraphBase.XYAxisWidth));
            // 绘制X轴的箭头
            // 箭头的绘制和矩形一样,只要传入四个顶点即可,见三角形的绘制详解图利用ABCD四个点绘制
            if (GraphBase.ShowXYAxisArrow)
            {
                float arrowUnit = GraphBase.ArrowSzie / 2.0f;
                Vector2 firstPoint = rightPoint + new Vector2(0 , arrowUnit);
                Vector2 secondPoint = rightPoint;
                Vector2 thirdPoint = rightPoint + new Vector2(0 , -arrowUnit);
                Vector2 fourPoint = rightPoint + new Vector2(Mathf.Sqrt(3)* arrowUnit , 0);
                vh.AddUIVertexQuad(GetQuad(firstPoint,secondPoint,thirdPoint,fourPoint,GraphBase.XYAxisColor));
            }
        }
        //绘制Y轴,获取Y轴上下两个顶点,绘制一个矩形
        if (GraphBase.ShowYAxis)
        {
            float height = _myRect.sizeDelta.y;
            Vector2 downPoint = new Vector2(0 , -height / 2.0f);
            Vector2 upPoint = new Vector2(0 , height / 2.0f);
            vh.AddUIVertexQuad(GetQuad(downPoint , upPoint , GraphBase.XYAxisColor , GraphBase.XYAxisWidth));
            // 绘制Y轴的箭头
            if ( GraphBase.ShowXYAxisArrow )
            {
                float arrowUnit = GraphBase.ArrowSzie / 2.0f;
                Vector2 firstPoint = upPoint + new Vector2(arrowUnit , 0);
                Vector2 secondPoint = upPoint;
                Vector2 thirdPoint = upPoint + new Vector2(-arrowUnit , 0);
                Vector2 fourPoint = upPoint + new Vector2(0 , Mathf.Sqrt(3) * arrowUnit);
                vh.AddUIVertexQuad(GetQuad(firstPoint , secondPoint , thirdPoint , fourPoint , GraphBase.XYAxisColor));
            }
        }

        #endregion

        #region 函数图的绘制
        //遍历函数公式,然后每隔一次像素绘制一个矩形
        foreach ( var functionFormula in Formulas )
        {
            Vector2 startPos = GetFormulaPoint(functionFormula.Formula , -_myRect.sizeDelta.x / 2.0f );
            //从X轴的负方向轴开始向正方向轴绘制
            for ( float x = -_myRect.sizeDelta.x / 2.0f + 1 ; x < _myRect.sizeDelta.x / 2.0f ; x++ )
            {
                Vector2 endPos = GetFormulaPoint(functionFormula.Formula , x );
                vh.AddUIVertexQuad(GetQuad(startPos , endPos , functionFormula.FormulaColor , functionFormula.FormulaWidth));
                //这里把当前绘制的结束点设置为下一次绘制的起始点
                startPos = endPos;
            }
        }

        #endregion
    }

    //通过两个端点绘制矩形
    private UIVertex[] GetQuad( Vector2 startPos , Vector2 endPos , Color color0 , float lineWidth = 2.0f )
    {
        float dis = Vector2.Distance(startPos , endPos);
        float y = lineWidth * 0.5f * ( endPos.x - startPos.x ) / dis;
        float x = lineWidth * 0.5f * ( endPos.y - startPos.y ) / dis;
        if ( y <= 0 ) y = -y;
        else x = -x;
        UIVertex[] vertex = new UIVertex[4];
        vertex[0].position = new Vector3(startPos.x + x , startPos.y + y);
        vertex[1].position = new Vector3(endPos.x + x , endPos.y + y);
        vertex[2].position = new Vector3(endPos.x - x , endPos.y - y);
        vertex[3].position = new Vector3(startPos.x - x , startPos.y - y);
        for ( int i = 0 ; i < vertex.Length ; i++ ) vertex[i].color = color0;
        return vertex;
    }

    //通过四个顶点绘制矩形
    private UIVertex[] GetQuad( Vector2 first , Vector2 second , Vector2 third , Vector2 four , Color color0 )
    {
        UIVertex[] vertexs = new UIVertex[4];
        vertexs[0] = GetUIVertex(first , color0);
        vertexs[1] = GetUIVertex(second , color0);
        vertexs[2] = GetUIVertex(third , color0);
        vertexs[3] = GetUIVertex(four , color0);
        return vertexs;
    }

    //构造UIVertex
    private UIVertex GetUIVertex( Vector2 point , Color color0 )
    {
        UIVertex vertex = new UIVertex
        {
            position = point ,
            color = color0 ,
            uv0 = new Vector2(0 , 0)
        };
        return vertex;
    }

    //利用Func委托,计算出每一个绘制点
    private Vector2 GetFormulaPoint( Func formula ,float xValue )
    {
        return new Vector2(xValue , formula(xValue / GraphBase.XYAxisScale) *50 );
    }
}
高级用法多种可自定义的UI组件

其他折线图,曲线图等。
以上展示的组件都只需要在UI空物体上添加一个脚本即可实现,纯代码实现不需要其他资源,而且每一个组件在不调用GUI.Text进行文字绘制的情况下,只占用一个Batch,极大的减少了CPU交付GPU绘制的次数,提升效率。以上的其他UI组件,会在后续的博文中更新,并附上全部源码。
==转载标明出处==
CSDN博客:http://blog.csdn.net/qq_29579137 查看更多别的博文