回归分析——批量梯度下降法和随机梯度下降法(python3版本)
1. 导入相关的库
import pandas as pd
import numpy as np
import matplotlib.pyplot as plt
import matplotlib.ticker as mtick
2.导入数据
filename = r'.../ex1/ex1data1.txt'
df = pd.read_table(filename, engine='python', sep=',', header=None) #读取数据
df.rename(columns={0:'profit',1:'population'}, inplace=True)        #修改数据列名
df.set_index(['profit'])
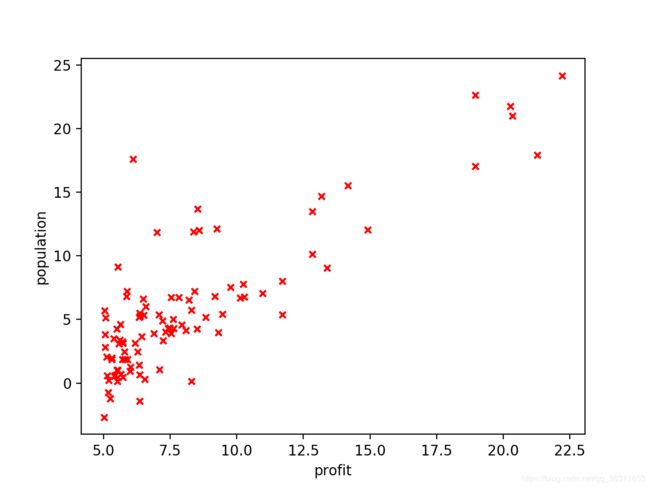
df.plot.scatter('profit','population', color='r', marker='x')       #绘制数据散点图
3.计算代价函数
代价函数: J ( θ ) = ∑ i = 1 m ( h θ ( x ( i ) ) − y ( i ) ) 2 J_{(\theta)} = {\sum}_{ i=1}^m{(h_{\theta}(x^{(i)})-y^{(i)})^2} J(θ)=∑i=1m(hθ(x(i))−y(i))2
假设函数: h θ ( x ) = θ T x = θ 0 + θ 1 x 1 h_{\theta} (x) = {\theta}^Tx={\theta_0}+{\theta_1}{x_1} hθ(x)=θTx=θ0+θ1x1
#cost function

def hyppthesis_function(X_matrix, Theta_matrix):
    h = Theta_matrix * X_matrix.T
    return h

def cost_function(X_matrix, Y_matrix, Theta_matrix):
    m = len(Y_matrix)
    h = hyppthesis_function(X_matrix, Theta_matrix)
    tmp_maxtix = h - Y_matrix
    tmp_array = np.array(tmp_maxtix)
    tmp_array = tmp_array ** 2
    sum_array = np.sum(tmp_array) / (2* m )
    sum_matrix = np.matrix(sum_array)
    return sum_matrix[0, 0]
4.梯度下降法
θ j : = θ j − α 1 m ∑ i = i m ( h θ ( x ( i ) ) − y ( i ) ) x j ( i ) \theta_j:=\theta_j -{\alpha}{\frac{1}{m}}{\sum}_{i=i}^m(h_{\theta}(x^{(i)})-y^{(i)})x_j^{(i)} θj:=θj−αm1∑i=im(hθ(x(i))−y(i))xj(i)
#theta更新函数
def theta_function(X_matrix, Y_matrix, Theta_matrix, alpha):
    m = len(X_matrix)
    h = hyppthesis_function(X_matrix, Theta_matrix)
    deri_value0 = (h - Y_matrix) * np.matrix(X_matrix[:,0]).T * alpha / m
    theta0 = Theta_matrix[0,0] - deri_value0

    deri_value1 = (h - Y_matrix) * np.matrix(X_matrix[:,1]).T * alpha / m
    theta1 = Theta_matrix[0,1] - deri_value1
    return np.hstack([theta0,theta1])
❤️ 批量梯度下降函数
def bgd_function(max_iteration, X_matrix, Y_matrix, Theta_matrix, alpha, epsilon):
    Cost_values_0 = 0
    Cost_values_lst = []
    Theta0_lst = []
    Theta1_lst = []
    for itera_num in range(max_iteration):
        Cost_values = cost_function(X_matrix, Y_matrix, Theta_matrix)
        if abs(Cost_values - Cost_values_0) < epsilon:
            print('The max iteration num is %d'%itera_num)
            break
        Cost_values_0 = Cost_values
        Cost_values_lst.append(Cost_values)

        Theta0_lst.append(Theta_matrix[0,0])
        Theta1_lst.append(Theta_matrix[0,1])
        Theta_matrix = theta_function(X_matrix, Y_matrix, Theta_matrix, alpha)
    return Cost_values_lst, Theta_matrix, Theta0_lst, Theta1_lst
if __name__='__main__':
	alpha = 0.01
	theta0 = 0
	theta1 = 0
	max_iteration = 1500
	epsilon = 0.001

	theta = [theta0, theta1]
	Theta_matrix = np.matrix(theta)

	X1_matrix = df.profit.values
	X0_matrix = np.ones(len(X1_matrix))

	X_matrix = np.vstack([X0_matrix, X1_matrix]).T
	Y_matrix = df.population.values

	Theta_matrix = np.matrix(theta)

	#利用迭代算法求解代价函数值和theta值
	Cost_values_lst, Theta_matrix, Theta0_lst, Theta1_lst = bgd_function(max_iteration, X_matrix, Y_matrix, Theta_matrix, alpha, epsilon)
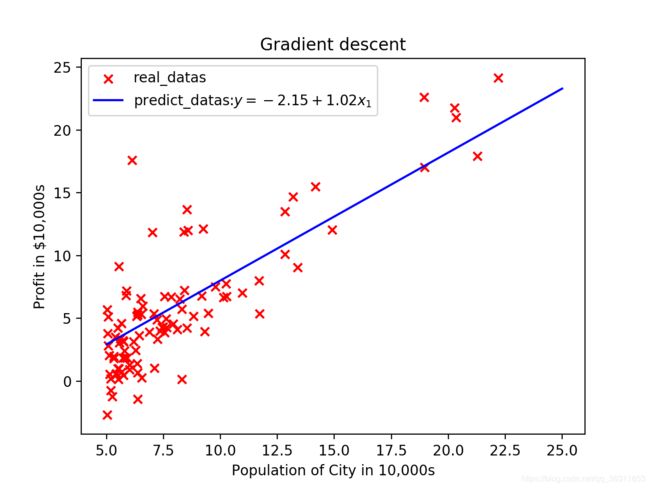
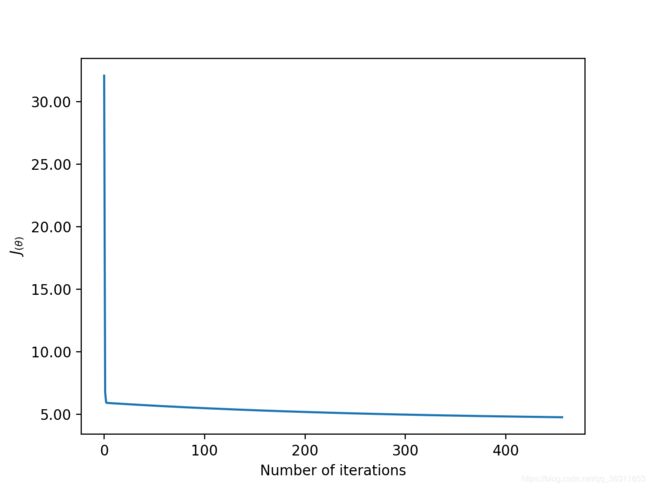
结果: 457次迭代后,代价函数的值为4.7545623167371724;theta0值为-2.15275293,theta1为1.01792758。
绘图
- 绘制拟合曲线
ax = plt.figure().add_subplot(111)
y_predict = theta_values * X_matrix.T
x = X_matrix[:,1].tolist()
y = y_predict.tolist()[0]
predict_datas, = ax.plot(x, y, color='b')
real_datas = ax.scatter(df.profit, df.population, color='r', marker='x')
ax.set_title('Gradient descent')
ax.set_xlabel('Population of City in 10,000s')
ax.set_ylabel('Profit in $10,000s')
plt.legend([real_datas, predict_datas],['real_datas',r'predict_datas:$y=%.2f+%.2fx_1$'%\
                                        (theta_values[0,0], theta_values[0,1])])
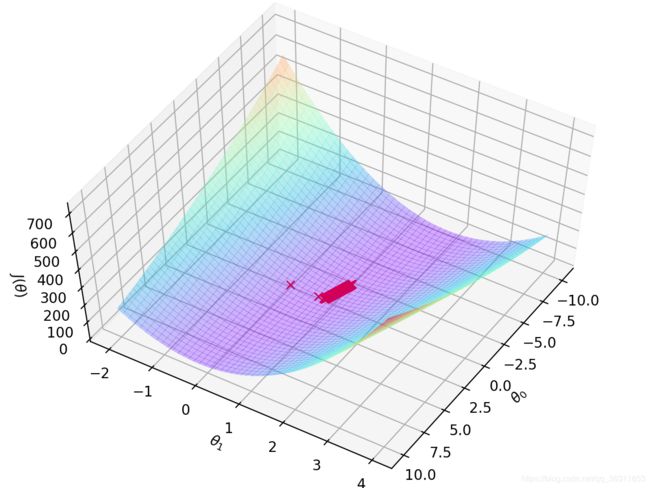
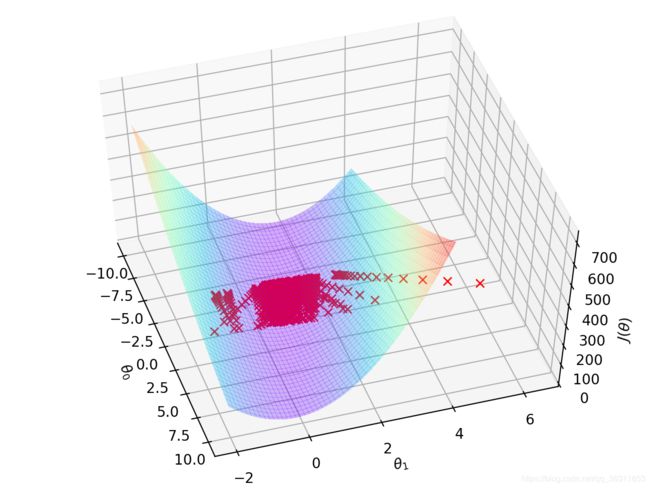
- 下降曲面
#定义图像和三维格式坐标轴
size = 100
theta0_val = np.linspace(-10,10, size)
theta1_val = np.linspace(-2, 4, size)
Cost_matrix = np.ones((size, size))
for i in range(size):
    for j in range(size):
        Theta_matrix = np.matrix([theta0_val[i], theta1_val[j]])
        H_values = hyppthesis_function(X_matrix, Theta_matrix)
        Cost_matrix[i, j] = cost_function(H_values, Y_matrix)

Cost_matrix = Cost_matrix.T
theta0_val, theta1_val = np.meshgrid(theta0_val, theta1_val)
fig = plt.figure()
ax3 = Axes3D(fig)
ax3.plot_surface(theta0_val, theta1_val, Cost_matrix, rstride=2, cstride=2, \
                 alpha=0.3, cmap=plt.cm.rainbow, linewidth=0, antialiased=False)
ax3.set_xlabel(r'$\theta_0$')
ax3.set_ylabel(r'$\theta_1$')
ax3.set_zlabel(r'$J(\theta)$')
ax3.plot(Theta0_lst, Theta1_lst, 'rx')
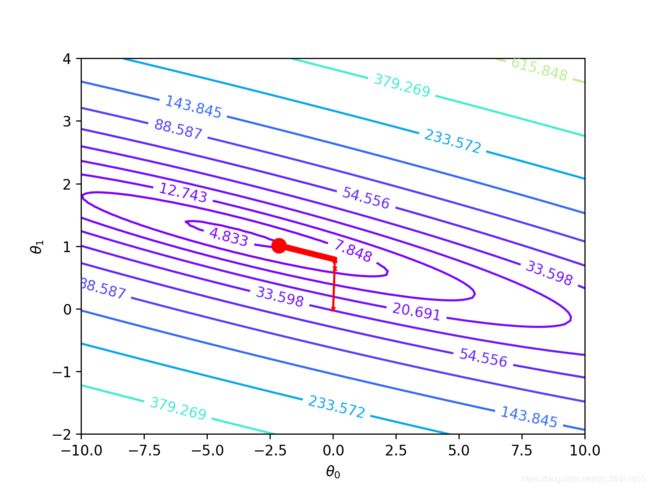
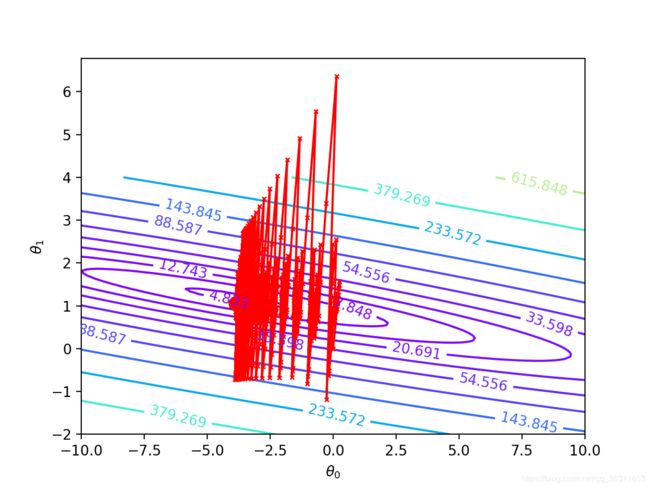
- 梯度下降等高线图
ax2 = plt.figure().add_subplot(111)
cs = plt.contour(theta0_val, theta1_val, Cost_matrix, np.logspace(-1, 3, 20), cmap=plt.cm.rainbow)
ax2.set_xlabel(r'$\theta_0$')
ax2.set_ylabel(r'$\theta_1$')
plt.clabel(cs, inline=1, fontsize=10)

#plot optimal solution
ax2.plot(theta_values[0,0], theta_values[0,1],'ro', markersize=10, linewidth=2)
#plot the process of bgd
ax2.plot(Theta0_lst, Theta1_lst, 'rx', markersize=3, linewidth=1)
ax2.plot(Theta0_lst, Theta1_lst, 'r-')
plt.show()
- 误差与迭代次数关系
ax2=plt.figure().add_subplot(111)
ax2.yaxis.set_major_formatter(mtick.FormatStrFormatter('%.2f'))

ax2.plot(range(len(cost_values)), cost_values)
ax2.set_xlabel('Number of iterations')
ax2.set_ylabel(r'$J_{(\theta)}$')
plt.show()
❤️ 随机梯度下降函数
def sgd_function(max_iteration, X_matrix, Y_matrix, Theta_matrix, alpha, epsilon):
    m = len(X_matrix)
    Cost_values_0 = 0
    Cost_values_lst = []
    Theta0_lst = []
    Theta1_lst = []
    for itera_num in range(max_iteration):
        Cost_values = cost_function(X_matrix, Y_matrix, Theta_matrix)
        if abs(Cost_values - Cost_values_0) < epsilon:
            print('The max iteration num is %d.\nThe number of specimen is %d.\n'%(itera_num,i))
            break
        Cost_values_0 = Cost_values
        Cost_values_lst.append(Cost_values)

        #此处是代码关键处,是bdg与sgd的差别的地方
        for i in range(m):
            Theta0_lst.append(Theta_matrix[0,0])
            Theta1_lst.append(Theta_matrix[0,1])
            Theta_matrix = theta_function(np.matrix(X_matrix[i]), np.matrix(Y_matrix[i]),Theta_matrix, alpha)
    return Cost_values_lst, Theta_matrix, Theta0_lst, Theta1_lst
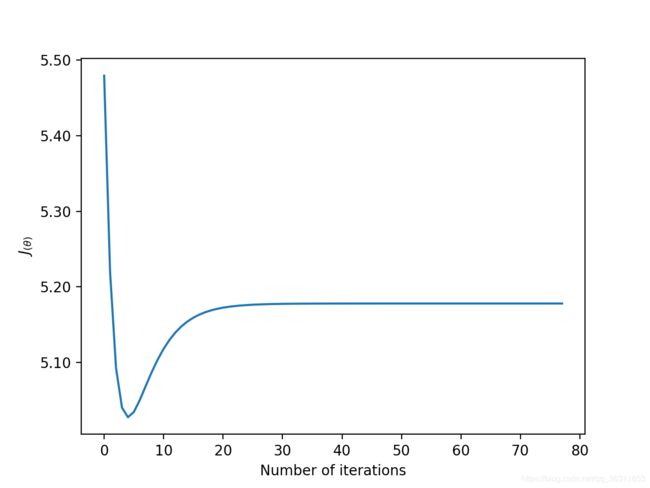
⚠️作图代码是一样的,这里只展示结果
⚠️博主非相关专业出生,转专业自学,写此博客纯为交流和分享,有错误之处请在留言处指出,谢谢?。
⚠️参考博客《斯坦福机器学习笔记》:https://yoyoyohamapi.gitbooks.io/mit-ml/content/
⚠️吴恩达《机器学习》课后作业,源数据下载:https://github.com/nsoojin/coursera-ml-py。
