基于SVM的思想做CIFAR-10图像分类
SVM
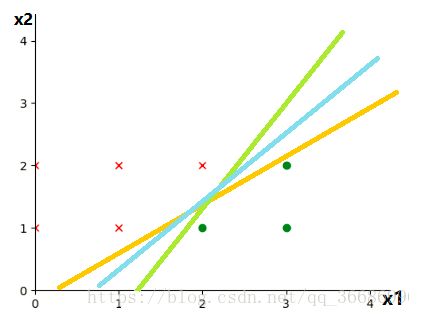
回顾一下之前的SVM,找到一个间隔最大的函数,使得正负样本离该函数是最远的,是否最远不是看哪个点离函数最远,而是找到一个离函数最近的点看他是不是和该分割函数离的最近的。
使用large margin来regularization。
之前讲SVM的算法:https://www.jianshu.com/p/8fd28df734a0
线性分类
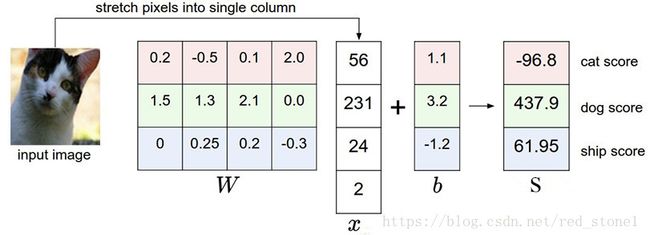
线性SVM就是一种线性分类的方法。输入,输出,每一个样本的权重是,偏置项bias是。得分函数
算出这么多个类别,哪一个类别的分数高,那就是哪个类别。比如要做的图像识别有三个类别,假设这张图片有4个像素,拉伸成单列:
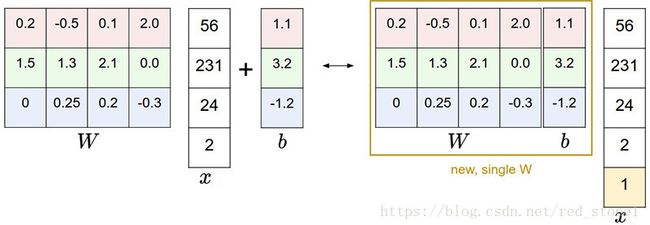
一般来说习惯会把w和b合并了,x加上一个全为1的列,于是有
损失函数
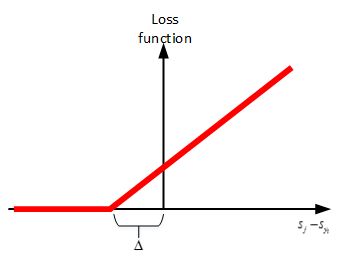
之前的SVM是把正负样本离分割函数有足够的空间,虽然正确的是猫,但是猫的得分是最低的,常规方法是将猫的分数提高,这样才可以提高猫的正确率。但是SVM里面是要求一个间隔最大化,提到这里来说,其实就是cat score不仅仅是要大于其他的分数,而且是要有一个最低阈值,cat score不能低于这个分数。
所以正确的分类score应该是要大于其他的分类score一个阈值:
就是正确分类的分数,就是其他分类的分数。所以,这个损失函数就是:只有正确的分数比其他的都大于一个阈值才为0,否则都是有损失的。
只有
这种squared hinge loss SVM与linear hinge loss SVM相比较,特点是对违背间隔阈值要求的点加重惩罚,违背的越大,惩罚越大。某些实际应用中,squared hinge loss SVM的效果更好一些。具体使用哪个,可以根据实际问题,进行交叉验证再确定。
对于
最后还要增加的就是过拟合,regularization的限制了。L2正则化:
加上正则化之后就是:
N是训练样本的个数,取平均损失函数,
代码实现
首先是对CIFAR10的数据读取:
def load_pickle(f):
    version = platform.python_version_tuple()
    if version[0] == '2':
        return pickle.load(f)
    elif version[0] == '3':
        return pickle.load(f, encoding='latin1')
    raise ValueError("invalid python version: {}".format(version))

def loadCIFAR_batch(filename):
    with open(filename, 'rb') as f:
        datadict = load_pickle(f)
        x = datadict['data']
        y = datadict['labels']
        x = x.reshape(10000, 3, 32, 32).transpose(0, 3, 2, 1).astype('float')
        y = np.array(y)
        return x, y

def loadCIFAR10(root):
    xs = []
    ys = []
    for b in range(1, 6):
        f = os.path.join(root, 'data_batch_%d' % (b, ))
        x, y = loadCIFAR_batch(f)
        xs.append(x)
        ys.append(y)
    X = np.concatenate(xs)
    Y = np.concatenate(ys)
    x_test, y_test = loadCIFAR_batch(os.path.join(root, 'test_batch'))
    return X, Y, x_test, y_test
首先要读入每一个文件的数据,先用load_pickle把文件读成字典形式,取出来。因为常规的图片都是(数量,高,宽,RGB颜色),在loadCIFAR_batch要用transpose来把维度调换一下。最后把每一个文件的数据都集合起来。
之后就是数据的格式调整了:
def data_validation(x_train, y_train, x_test, y_test):
    num_training = 49000
    num_validation = 1000
    num_test = 1000
    num_dev = 500
    mean_image = np.mean(x_train, axis=0)
    x_train -= mean_image
    mask = range(num_training, num_training + num_validation)
    X_val = x_train[mask]
    Y_val = y_train[mask]
    mask = range(num_training)
    X_train = x_train[mask]
    Y_train = y_train[mask]
    mask = np.random.choice(num_training, num_dev, replace=False)
    X_dev = x_train[mask]
    Y_dev = y_train[mask]
    mask = range(num_test)
    X_test = x_test[mask]
    Y_test = y_test[mask]
    X_train = np.reshape(X_train, (X_train.shape[0], -1))
    X_val = np.reshape(X_val, (X_val.shape[0], -1))
    X_test = np.reshape(X_test, (X_test.shape[0], -1))
    X_dev = np.reshape(X_dev, (X_dev.shape[0], -1))
    X_train = np.hstack([X_train, np.ones((X_train.shape[0], 1))])
    X_val = np.hstack([X_val, np.ones((X_val.shape[0], 1))])
    X_test = np.hstack([X_test, np.ones((X_test.shape[0], 1))])
    X_dev = np.hstack([X_dev, np.ones((X_dev.shape[0], 1))])
    return X_val, Y_val, X_train, Y_train, X_dev, Y_dev, X_test, Y_test
    pass
数据要变成一个长条。
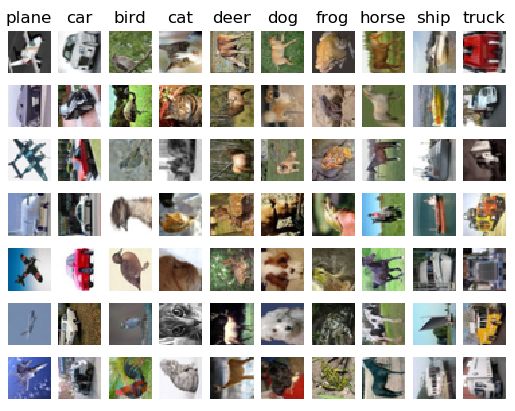
先看看数据长啥样:
def showPicture(x_train, y_train):
    classes = ['plane', 'car', 'bird', 'cat', 'deer', 'dog', 'frog', 'horse', 'ship', 'truck']
    num_classes = len(classes)
    samples_per_classes = 7
    for y, cls in enumerate(classes):
        idxs = np.flatnonzero(y_train == y)
        idxs = np.random.choice(idxs, samples_per_classes, replace=False)
        for i, idx in enumerate(idxs):
            plt_index = i*num_classes +y + 1
            plt.subplot(samples_per_classes, num_classes, plt_index)
            plt.imshow(x_train[idx].astype('uint8'))
            plt.axis('off')
            if i == 0:
                plt.title(cls)
    plt.show()
然后就是使用谷歌的公式了:
    def loss(self, x, y, reg):
        loss = 0.0
        dw = np.zeros(self.W.shape)
        num_train = x.shape[0]
        scores = x.dot(self.W)
        correct_class_score = scores[range(num_train), list(y)].reshape(-1, 1)
        margin = np.maximum(0, scores - correct_class_score + 1)
        margin[range(num_train), list(y)] = 0
        loss = np.sum(margin)/num_train + 0.5 * reg * np.sum(self.W*self.W)

        num_classes = self.W.shape[1]
        inter_mat = np.zeros((num_train, num_classes))
        inter_mat[margin > 0] = 1
        inter_mat[range(num_train), list(y)] = 0
        inter_mat[range(num_train), list(y)] = -np.sum(inter_mat, axis=1)

        dW = (x.T).dot(inter_mat)
        dW = dW/num_train + reg*self.W
        return loss, dW
        pass
操作都是常规操作,算出score然后求loss最后SGD求梯度更新W。
    def train(self, X, y, learning_rate=1e-3, reg=1e-5, num_iters=100,batch_size=200, verbose=False):
        num_train, dim = X.shape
        num_classes = np.max(y) + 1
        if self.W is None:
            self.W = 0.001 * np.random.randn(dim, num_classes)
        # Run stochastic gradient descent to optimize W
        loss_history = []
        for it in range(num_iters):
            X_batch = None
            y_batch = None
            idx_batch = np.random.choice(num_train, batch_size, replace = True)
            X_batch = X[idx_batch]
            y_batch = y[idx_batch]
            # evaluate loss and gradient
            loss, grad = self.loss(X_batch, y_batch, reg)
            loss_history.append(loss)
            self.W -=  learning_rate * grad
            if verbose and it % 100 == 0:
                print('iteration %d / %d: loss %f' % (it, num_iters, loss))
        return loss_history
        pass
预测:
    def predict(self, X):
        y_pred = np.zeros(X.shape[0])
        scores = X.dot(self.W)
        y_pred = np.argmax(scores, axis = 1)
        return y_pred
最后运行函数:
 svm = LinearSVM()
    tic = time.time()
    cifar10_name = '../Data/cifar-10-batches-py'
    x_train, y_train, x_test, y_test = loadCIFAR10(cifar10_name)
    X_val, Y_val, X_train, Y_train, X_dev, Y_dev, X_test, Y_test = data_validation(x_train, y_train, x_test, y_test)
    loss_hist = svm.train(X_train, Y_train, learning_rate=1e-7, reg=2.5e4,
                          num_iters=3000, verbose=True)
    toc = time.time()
    print('That took %fs' % (toc - tic))
    plt.plot(loss_hist)
    plt.xlabel('Iteration number')
    plt.ylabel('Loss value')
    plt.show()
    y_test_pred = svm.predict(X_test)
    test_accuracy = np.mean(Y_test == y_test_pred)
    print('accuracy: %f' % test_accuracy)
    w = svm.W[:-1, :]  # strip out the bias
    w = w.reshape(32, 32, 3, 10)
    w_min, w_max = np.min(w), np.max(w)
    classes = ['plane', 'car', 'bird', 'cat', 'deer', 'dog', 'frog', 'horse', 'ship', 'truck']
    for i in range(10):
        plt.subplot(2, 5, i + 1)
        wimg = 255.0 * (w[:, :, :, i].squeeze() - w_min) / (w_max - w_min)
        plt.imshow(wimg.astype('uint8'))
        plt.axis('off')
        plt.title(classes[i])
    plt.show()
首先是画出整个loss函数趋势:
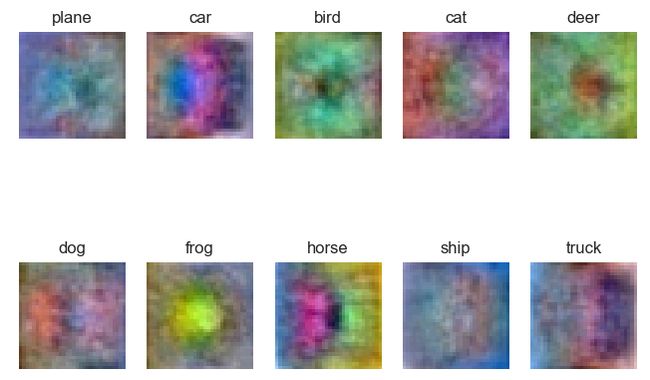
最后再可视化一下w权值,看看每一个种类提取处理的特征是什么样子的:
