Python:第六次全国人口普查数据分析及可视化(pandas、matplotlib)
一、数据获取
在国家统计局网中下载第六次人口普通统计表:http://www.stats.gov.cn/tjsj/pcsj/rkpc/6rp/indexch.htm
然后通过pandas将excel数据解析为多级字典
先观察excel数据
可以转化为这样的多级词典:
理清字典关系后代码就简单了
def getDataDict():
    #skiprows指跳过的行下标(下标从0开始),=2即从第3行开始,返回类型为dataframe
    dataFrame = pandas.read_excel('D:/Py/2010人口普查.xlsx',skiprows=2)
    #获取民族列表,民族字符串中有空格,通过map函数清洗数据
    #iloc函数中表示解析下标为第0行,第1列之后的,并且步长为3;
    #使用map函数后转化为了map类型数据,注意转回list类型
    raceList = list(map(lambda s:str(s).replace("\xa0",""),dataFrame.iloc[0,1:][::3].tolist()))
    #获取年龄划分列表
    ageList = list(map(lambda s:str(s).replace("\xa0",""),dataFrame.iloc[2:, 0].tolist()))
    #使用collections模块下的OrderedDict,保证排序
    dataDict = OrderedDict()

    for i in range(len(raceList)):
        #获取民族的名称
        race = raceList[i]
        raceDict = OrderedDict()
        #获取raceDict的key值(小计、男、女)丢到列表中
        raceDictKeyList = dataFrame.iloc[1,1+3*i:1+3*i+3].tolist()

        for j in range(len(raceDictKeyList)):
            #获取小计、男、女
            raceDictKey = raceDictKeyList[j]
            #获取trdDict中的value值
            ageValueList = dataFrame.iloc[2:,1+3*i+j].tolist()
            trdDict = OrderedDict()
            #向trdDict中插入value(年龄)
            for k in range(len(ageValueList)):
                age = str(ageList[k])
                trdDict[age] = ageValueList[k]
            raceDict[raceDictKey] = trdDict
        dataDict[race] = raceDict
    return dataDict
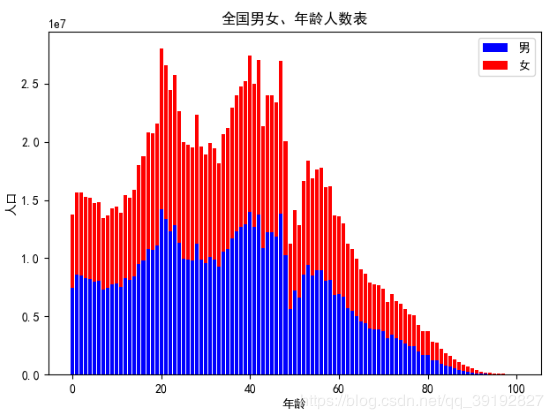
二、全国男女,年龄人口直方图
代码:
def showChart1():
    maleDict = dataDict.get('合计').get('男')
    femaleDict = dataDict.get('合计').get('女')
    maleNumList = []
    for i, items in enumerate([maleDict.items(), femaleDict.items()]):
        ageList = []
        numList = []
        for k, v in items:
            if str(k).isdigit() or str(k) == '100岁及以上':
                if (str(k) == '100岁及以上'):
                    k = '100'
                ageList.append(int(k))
                numList.append(v)
                if i == 0:
                    maleNumList = numList[:]
        #i=0时即操作的是男性列表
        if i == 0:
            male = pyplot.bar(ageList, numList, color='b')
        else:
            #女性列表的bottom为对应男性列表,达到叠层效果
            female = pyplot.bar(ageList, numList, bottom=maleNumList, color='r')
    pyplot.rcParams['font.sans-serif'] = ['SimHei']
    pyplot.title('全国男女、年龄人数表')
    pyplot.xlabel('年龄')
    pyplot.ylabel('人口')
    pyplot.legend((male[0], female[2]), ('男', '女'))
    pyplot.show()
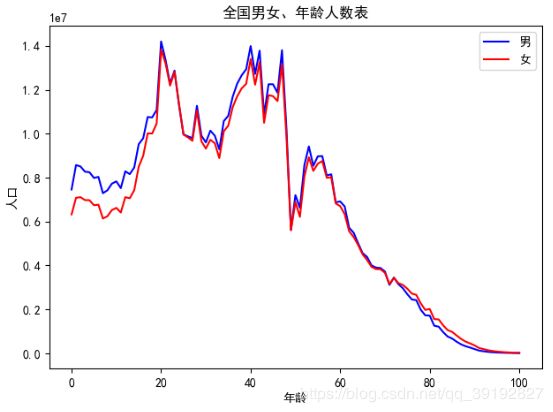
折线图:
由于是2010年的数据,年龄位于0-20之间,现在9-29岁了,这男女比例也太难了
三、全国人口年龄阶段分布图
pyplot好像是达不到labels用线指出来的效果,所以导致占比例过小再显示标签文字会重叠,索性把75岁以上的统计在一起了
def showChart2():
    data = dataDict.get('合计').get('合计')
    ageCountList = []
    ageLabelList = []
    for k, v in data.items():
        if not str(k).isdigit() and str(k) != '总计' and str(k) != 'nan':
            ageCountList.append(int(v))
            ageLabelList.append(k)
    index = ageLabelList.index('75-79岁')
    numOld = 0
    for i in range(len(ageCountList)):
        if i >= index:
            numOld += ageCountList[i]
        else:
            pass
    ageCountList[index] = numOld
    ageLabelList[index] = '75岁及以上'
    ageCountList = ageCountList[:index + 1]
    ageLabelList = ageLabelList[:index + 1]
    pyplot.title('全国人口年龄分布图')
    pyplot.rcParams['font.sans-serif'] = ['SimHei']
    pyplot.pie(ageCountList, labels=ageLabelList, counterclock=False, autopct='%1.1f%%')
    pyplot.show()


