统计学习(第一章)李航 最小二乘拟合正弦函数,正则化
1.用最小二乘法拟合曲线
"用目标函数y=sin2πx, 加上一个正态分布的噪音干扰,用多项式去拟合"
import numpy as np
import matplotlib.pyplot as plt
from scipy.optimize import leastsq#最小二乘

def real_f(x):#目标函数
    return np.sin(2*np.pi*x)
def fit_f(p, x):#多项式
    f = np.poly1d(p)#多项式函数
    return f(x)
def residuals_f(p,x,y):#残差, y预测值
    return fit_f(p,x) - y

x = np.linspace(0, 1, 10)#10个噪声点
x_points = np.linspace(0, 1, 1000)#1000个真实目标点
y_ = real_f(x)
y = [np.random.normal(0,0.1) + y1 for y1 in y_]#加均值0、方差0.1的正态分布噪音
# print(y)

#拟合函数
def f(M = 0):#M多项式次数
    p_init = np.random.rand(M+1)#随机初始化多项式参数,次数为M+1个
    p_lsq = leastsq(residuals_f, p_init, args=(x, y))#三个参数:误差函数、函数参数列表、数据点
    print('Fitting Parameters', p_lsq[0])

    plt.plot(x_points, real_f(x_points), label = 'real')#真实曲线
    plt.plot(x_points, fit_f(p_lsq[0], x_points), label = 'fitted')#拟合曲线
    plt.plot(x, y, 'bo',label = 'noise')#bo蓝,ro红
    plt.legend()#加图例
    plt.show()
    return p_lsq

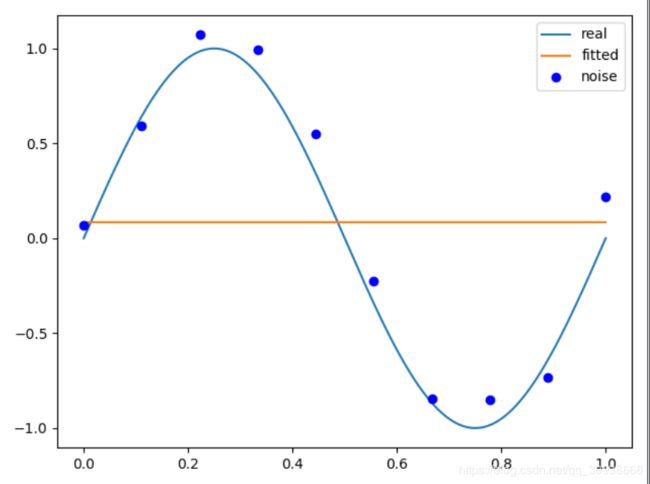
p_lsq_0 = f(M=0)
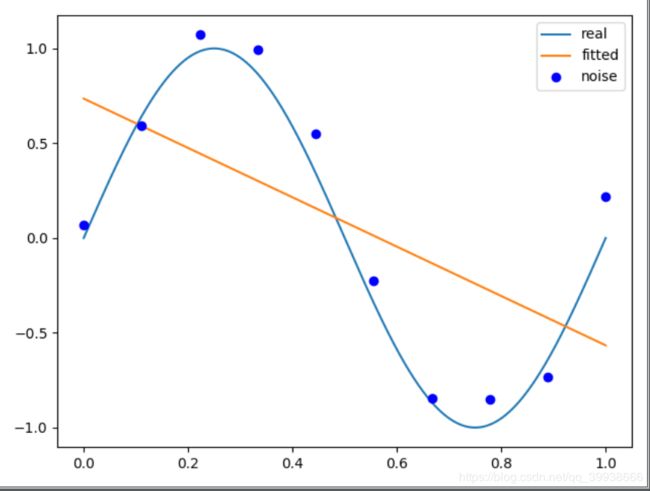
p_lsq_1 = f(M=1)
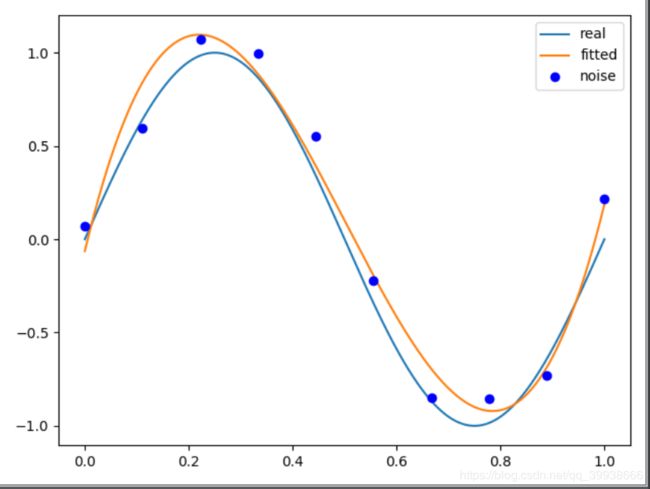
p_lsq_3 = f(M=3)
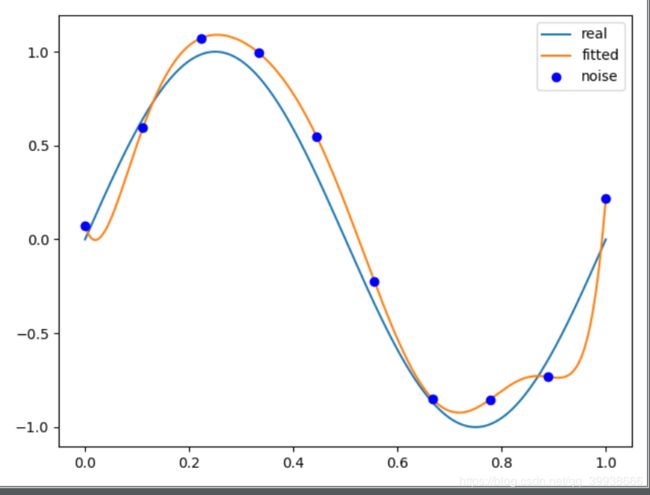
p_lsq_9 = f(M=9)
M=0:
Fitting Parameters [0.08448856]
M=1:
Fitting Parameters [-1.30154406 0.7352606 ]
M=3:
Fitting Parameters [ 22.44579609 -33.8218247 11.62629268 -0.06332948]
M=9:
Fitting Parameters [ 1.82375584e+02 2.43791693e+03 -1.09575769e+04 1.79559584e+04
-1.51086907e+04 7.17416839e+03 -1.93675226e+03 2.60956104e+02
-8.20740890e+00 7.11734480e-02]
2.正则化
由上图可见,当M=9,显示过拟合, 所以引入正则化项(regularizer),降低过拟合
回归问题中,损失函数是平方损失,正则化可以是参数向量的L2范数,也可以是L1范数。
-
L1: regularization*abs(p)
-
L2: 0.5 * regularization * np.square(p)
"用目标函数y=sin2πx, 加上一个正态分布的噪音干扰,用多项式去拟合"
import numpy as np
import matplotlib.pyplot as plt
from scipy.optimize import leastsq#最小二乘

def real_f(x):#目标函数
    return np.sin(2*np.pi*x)
def fit_f(p, x):#多项式
    f = np.poly1d(p)#多项式函数
    return f(x)
def residuals_f(p,x,y):#残差, y预测值
    return fit_f(p,x) - y

'采用L2正则化'
lamda = 0.0001
def residuals_f_regularization(p,x,y):
    ret = fit_f(p,x) - y
    return np.append(ret, 0.5*lamda*np.square(p))

x = np.linspace(0, 1, 10)#10个噪声点
x_points = np.linspace(0, 1, 1000)#1000个真实目标点
y_ = real_f(x)
y = [np.random.normal(0,0.1) + y1 for y1 in y_]#加均值0、方差0.1的正态分布噪音
# print(y)

#拟合函数
def f(M = 0):#M多项式次数
    p_init = np.random.rand(M+1)#随机初始化多项式参数,次数为M+1个
    p_lsq = leastsq(residuals_f, p_init, args=(x, y))#三个参数:误差函数、函数参数列表、数据点
    p_lsq_regularization = leastsq(residuals_f_regularization, p_init, args=(x, y))
    print('Fitting Parameters', p_lsq[0])

    plt.plot(x_points, real_f(x_points), label = 'real')#真实曲线
    plt.plot(x_points, fit_f(p_lsq[0], x_points), label = 'fitted')#拟合曲线
    plt.plot(x_points, fit_f(p_lsq_regularization[0], x_points), label = 'regularization')#正则化后的拟合曲线
    plt.plot(x, y, 'bo',label = 'noise')#bo蓝,ro红
    plt.legend()#加图例
    plt.show()
    return p_lsq

p_lsq_9 = f(M=9)
M=9:
Fitting Parameters [ 4.76887118e+04 -2.13138573e+05 3.99285066e+05 -4.07159339e+05
2.45507544e+05 -8.89206003e+04 1.87421262e+04 -2.10846132e+03
1.03908481e+02 -2.43222631e-01]


