程序设计思路:体育竞技实例、 霍兰德人人格分析实例
程序设计思路:体育竞技实例
#MatchAnalysis.py

from random import random

#介绍比赛规则
def printintro():
    print("这个程序模拟两个选手A和B的某种竞技比赛")
    print('程序运行需要A和B的能力值(以0-1间的小数表示)')

#输入比赛信息
def getinputs():
    a = eval(input("请输入A的能力值(0-1):"))
    b = eval(input("请输入B的能力值(0-1):"))
    n = eval(input('模拟比赛场次:'))
    return a ,b ,n

#模拟n场比赛,根据每场比赛分数,确定双方赢的场次
def simngames(n,probA,probB):
    winsA,winsB= 0, 0
    for i in range(n):
        scoreA ,scoreB=simonegame(probA,probB)
        if scoreA>scoreB:
            winsA+=1
        else:
            winsB+=1
    return winsA,winsB


#确定一场游戏结束标志
def gameover(a,b):
    return a==15 or b==15

#模拟一场游戏,通过比较随机数与能力值大小,确定分数
def simonegame(probA,probB):
    scoreA,scoreB=0,0
    serving ="A"    #确定发球顺序
    while not gameover(scoreA,scoreB):
        if serving =='A':
            if random()< probA:
                scoreA+=1
            else:
                serving='B'
        else:
            if random()<probB:
                scoreB+=1
            else:
                serving='A'
    return scoreA,scoreB

#游戏结果
def printsummary(winsA,winsB):
    n=winsA+winsB
    print('竞技分析开始,共模拟{}场比赛'.format(n))
    print('选手A获胜{}场比赛,占比{:0.1%}'.format(winsA,winsA/n))
    print('选手B获胜{}场比赛,占比{:0.1%}'.format(winsB, winsB/n))

#游戏进行顺序
def main():
    printintro()
    probA,probB,n=getinputs()
    winsA,winsB = simngames(n,probA,probB)
    printsummary(winsA,winsB)

#执行游戏
main()
运行效果如下:
D:\Anaconda3\python.exe D:/Python_pycharm_projects/yuyanseji_examples(20190404)/MatchAnalysis.py
这个程序模拟两个选手A和B的某种竞技比赛
程序运行需要A和B的能力值(以0-1间的小数表示)
请输入A的能力值(0-1):0.51
请输入B的能力值(0-1):0.501
模拟比赛场次:10000
竞技分析开始,共模拟10000场比赛
选手A获胜5678场比赛,占比56.8%
选手B获胜4322场比赛,占比43.2%

Process finished with exit code 0
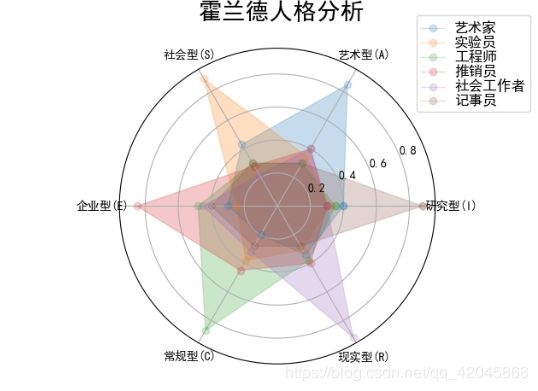
霍兰德人人格分析实例
#HollandRadarDraw.py

import numpy as np
import matplotlib.pyplot as plt
import matplotlib

matplotlib.rcParams['font.family']='SimHei'
radar_labels = np.array(['研究型(I)','艺术型(A)','社会型(S)',\
                         '企业型(E)','常规型(C)','现实型(R)']) #雷达标签
nAttr = 6
data = np.array([[0.40, 0.32, 0.35, 0.30, 0.30, 0.88],

                 [0.85, 0.35, 0.30, 0.40, 0.40, 0.30],

                 [0.43, 0.89, 0.30, 0.28, 0.22, 0.30],

                 [0.30, 0.25, 0.48, 0.85, 0.45, 0.40],

                 [0.20, 0.38, 0.87, 0.45, 0.32, 0.28],

                 [0.34, 0.31, 0.38, 0.40, 0.92, 0.28]]) #数据值

data_labels = ('艺术家', '实验员', '工程师', '推销员', '社会工作者','记事员')
angles = np.linspace(0, 2*np.pi, nAttr, endpoint=False)
data = np.concatenate((data, [data[0]]))
angles = np.concatenate((angles, [angles[0]]))
fig = plt.figure(facecolor="white")
plt.subplot(111, polar=True)
plt.plot(angles,data,'o-', linewidth=1, alpha=0.2)
plt.fill(angles,data, alpha=0.25)
plt.thetagrids(angles*180/np.pi, radar_labels)
plt.figtext(0.52, 0.95, '霍兰德人格分析', ha='center', size=20)
legend = plt.legend(data_labels, loc=(0.94, 0.80), labelspacing=0.1)
plt.setp(legend.get_texts(), fontsize='large')
plt.grid(True)
plt.savefig('holland_radar.jpg')
plt.show()
