数据大清洗_Pandas库进阶(Pandas聚合查询)(Pandas透视表与交叉表)
目录
- 一、Pandas聚合查询
- 1.使用 groupby 方法进行分组聚合
- 2.使用 agg 函数进行聚合数据
- 3.案例:店铺营业额案例
- 二、Pandas透视表与交叉表
- 1.利用 pivot_table 函数可以实现透视表 、
一、Pandas聚合查询
1.使用 groupby 方法进行分组聚合
1、分组
参数说明:


groupby 方法的参数及其说明——by 参数的特别说明:
	 如果传入的是一个函数则对索引进行计算并分组。
	 如果传入的是一个字典或者 Series,则字典或者 Series 的值用来做分组依据。
	 如果传入一个 NumPy 数组,则数据的元素作为分组依据。
	 如果传入的是字符串或者字符串列表,则使用这些字符串所代表的字段作为分组依据。
2、聚合
用 groupby 方法分组后的结果并不能直接查看,而是被存在内存中,输出的是内存地址。 实际上分组后的数据对象 groupby 类似 Series 与 DataFrame,是 pandas 提供的一种对象。

代码实现:
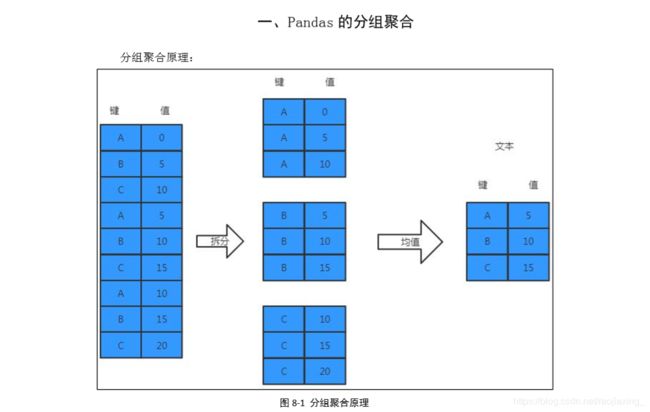
# 分组聚合--->按照一定的规则进行分组,在各组内统计指标--->自动合并
# 如何分组??? # 统计指标??
# groupby ---by来指定分组
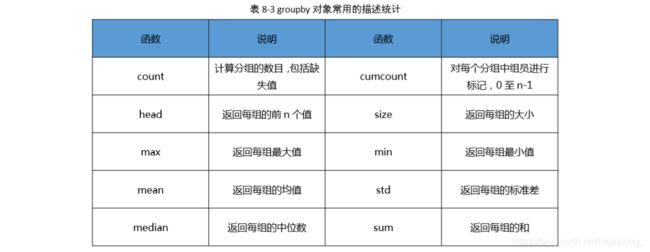
# 常用指标:max min std mean head count ...
import pandas as pd
import numpy as np
# 构造一个行索引
index = ['stu_' + str(i) for i in range(12)]
# 创建一个df来对它进行分组聚合
df = pd.DataFrame(
data={
'cls_id': ['A', 'A', 'A', 'A', 'A', 'A', 'B', 'B', 'B', 'B', 'B', 'B'],
'group_id': [1, 1, 1, 2, 2, 2, 1, 1, 1, 2, 2, 2],
'name': ['zs', 'ls', 'ww', 'zl', 'xx', 'uu', 'yy', 'kk', 'ii', 'oo', 'zz', 'qq'],
'height': [178.0, 182.0, 175.5, 168.0, 152.0, 169.0, 173.5, 180.5, 156.5, 172.0, 190.0, 192.0],
'score': [98, 96, 85, 87, 88, 65, 60, 92, 59, 87, 62, 88]
},
index=index
)
print('df:\n', df)
print('df的类型:\n', type(df))
print('*' * 100)
# 按照班级 进行分组,统计每个班级的学员身高的最大值
# 按照单列进行分组,统计组内的最大值
# res = df.groupby(by='cls_id')['height'].max()
# print('res:\n', res)
# cls_id
# A 182.0
# B 192.0
# Name: height, dtype: float64
# 按照班级进行分组,统计各个班级的身高、成绩平均值
# 按照单列进行分组,统计多列的指标
# res = df.groupby(by='cls_id')[['height', 'score']].mean()
# print('res:\n', res)
# res:
# height score
# cls_id
# A 170.750000 86.500000
# B 177.416667 74.666667
# # 按照班级、小组的学员的身高的最大值
# # 按照多列进行分组,统计单列指标
# res = df.groupby(by=['cls_id', 'group_id'])['height'].max()
# print('res:\n', res)
# print('res的类型:\n', type(res)) # 2.使用 agg 函数进行聚合数据
DataFrame.agg(func, axis=0, *args, **kwargs)
# 分组聚合--->按照一定的规则进行分组,在各组内统计指标--->自动合并
# 如何分组???    # 统计指标??
# groupby ---by来指定分组
# 常用指标:max min std mean head count ...
import pandas as pd
import numpy as np

# 构造一个行索引
index = ['stu_' + str(i) for i in range(12)]

# 创建一个df来对它进行分组聚合
df = pd.DataFrame(
    data={
        'cls_id': ['A', 'A', 'A', 'A', 'A', 'A', 'B', 'B', 'B', 'B', 'B', 'B'],
        'group_id': [1, 1, 1, 2, 2, 2, 1, 1, 1, 2, 2, 2],
        'name': ['zs', 'ls', 'ww', 'zl', 'xx', 'uu', 'yy', 'kk', 'ii', 'oo', 'zz', 'qq'],
        'height': [178.0, 182.0, 175.5, 168.0, 152.0, 169.0, 173.5, 180.5, 156.5, 172.0, 190.0, 192.0],
        'score': [98, 96, 85, 87, 88, 65, 60, 92, 59, 87, 62, 88]
    },
    index=index
)
print('df:\n', df)
print('df的类型:\n', type(df))
print('*' * 100)

# agg不能分组,只能求指标
# agg = aggregate

# 可以使用agg求出多列的多个指标
# 可以使用agg求出height 、score 的最大值、均值多个指标
# print(df[['height', 'score']].agg([np.max, np.mean]))

# 可以使用agg求出不同列的不同指标
# 同时统计身高的最大值、成绩的平均值
# print(df.agg({'height': [np.max], 'score': [np.mean]}))

# 可以使用agg求取不同列的不同个数的统计指标
# 求出身高的最大值,求出成绩的最小值、均值
# print(df.agg({'height': [np.max], 'score': [np.min, np.mean]}))

# 自定义函数 ---对height列 和score列分别 + 100操作
# print(df[['height', 'score']].agg(lambda x: x + 100))

# 也可以使用transform ---使用不是特别多
# transform也能实现agg自定义功能
# print(df[['height', 'score']].transform(lambda x: x + 100))

# 可以对分组之后的对象进行操作
# agg和transform区别
# transform-->返回的内容行数,之前传进去的匹配
# print(df.groupby(by='cls_id')[['height', 'score']].transform(np.sum))
3.案例:店铺营业额案例
目的:统计每日的营业额数据。
import pandas as pd

# 加载数据
detail = pd.read_excel('./meal_order_detail.xlsx')
print('detail:\n', detail)
print('detail的列索引:\n', detail.columns)

# 以第0个sheet为例
# 获取该店铺的营业额?
# 每日的营业额 ---->将数据分组 每日的数据 ---按照日进行分组 ---->统计每日内部的营业额
# 无营业额这列数据
# 数量 * 单价  ---> 菜品的营业额 --->对该日的 ---每个菜品的营业额--->求和 ---->该日的营业额

# (1) 获取日属性
# 先将 place_order_time 转化为pandas默认支持的时间序列
detail.loc[:, 'place_order_time'] = pd.to_datetime(detail.loc[:, 'place_order_time'])
# 利用列表推导式获取时间属性
detail.loc[:, 'day'] = [i.day for i in detail.loc[:, 'place_order_time']]

# (2)构建每个菜品的营业额
# 每个菜品的营业额--->数量 * 单价
detail.loc[:, 'pay'] = detail.loc[:, 'counts'] * detail.loc[:, 'amounts']

print('detail:\n', detail)

# (3)求出每日的营业额
# 按照day进行分组,然后统计pay的sum
day_pay = detail.groupby(by='day')['pay'].sum()

print('day_pay:\n', day_pay)

# 假设存在 8月、9月、10月--->每日的营业数据---->每日的营业额
# 找 month day 属性,计算每个菜品的收入 ---->按照 [month day] 分组,统计 菜品收入 sum
二、Pandas透视表与交叉表
1.利用 pivot_table 函数可以实现透视表 、
pands.pivot_table(data,values=None,index=None,columns=None,aggfunc='mea	n',f
ill_value=None,margins=False,dropna=True,margins_name='All')
import pandas as pd
import numpy as np

# 透视表 ---plus版本的分组聚合 ---分组聚合全部可以使用透视表来替代
# 构造一个行索引
index = ['stu_' + str(i) for i in range(12)]

# 创建一个df来对它进行分组聚合
df = pd.DataFrame(
    data={
        'cls_id': ['A', 'A', 'A', 'A', 'A', 'A', 'B', 'B', 'B', 'B', 'B', 'B'],
        'group_id': [1, 1, 1, 2, 2, 2, 1, 1, 1, 2, 2, 2],
        'name': ['zs', 'ls', 'ww', 'zl', 'xx', 'uu', 'yy', 'kk', 'ii', 'oo', 'zz', 'qq'],
        'height': [178.0, 182.0, 175.5, 168.0, 152.0, 169.0, 173.5, 180.5, 156.5, 172.0, 190.0, 192.0],
        'score': [98, 96, 85, 87, 88, 65, 60, 92, 59, 87, 62, 88]
    },
    index=index
)
print('df:\n', df)
print('df的类型:\n', type(df))
print('*' * 100)

# 按照班级进行分组,统计各个班级的身高的最大值
# print(df.groupby(by='cls_id')['height'].max())

# 可以使用 pd.pivot_table 创建透视表
# data --用来创建透视表的数据
# values ---关心的主体
# index --->按照index指定列进行分组,--->结果的index
# aggfunc---对关心主体所统计的指标
res = pd.pivot_table(data=df,
                     values='height',
                     index='cls_id',
                     aggfunc='max'
                     )
print('res:\n', res)
# 返回的结果的类型 跟pandas版本有关
# 如果你返回的是series--->后续的操作就是series的操作
# 如果你返回的是dataframe--->后续的操作就是dataframe的操作

# 按照班级、小组进行分组,统计身高、成绩均值
# print(df.groupby(by=['cls_id', 'group_id'])[['height', 'score']].mean())

# 创建透视表
# res = pd.pivot_table(data=df,
#                      values=['height', 'score'],
#                      index=['cls_id', 'group_id'],
#                      aggfunc='mean'
# )
# print('res:\n',res)

# 创建透视表
# 也可以指定其列的名称 ---按列进行分组
# columns ---指定其列分组
# fill_value ---默认为None,可以指定替换缺失值
# dropna --True,会干掉整列都是缺失的这样的列
# margins  ---开关,多出一列、一行数据 ---根据你的aggfunc统计指标来计算的数据
# margins_name ---->默认 ALL
# res = pd.pivot_table(data=df,
#                      values='height',
#                      index='cls_id',
#                      aggfunc='mean',
#                      columns='group_id',
#                      # margins=True,
#                      # margins_name
#                      )
# print('res:\n', res)


# 交叉表:特殊的透视表,计算两两之间的频率
# pd.crosstab --->创建交叉表
# index --->结果的行索引
# columns --->结果的列索引
# 在满足行列的条件下,出现数据的次数
# res = pd.crosstab(index=df['height'],
#                   columns=df['score'])
# print('res:\n',res)


# 创建交叉表
# values ---关心的主体
# aggfunc---统计的指标
# values 和 aggfunc 必须同时出现
# index 与 columns 必须同时出现
res = pd.crosstab(index=df['cls_id'],
                  columns=df['group_id'],
                  values=df['height'],
                  aggfunc=np.max
                  )
print('res:\n', res)


