三分钟带你对 Softmax 划重点
个人网站:红色石头的机器学习之路
CSDN博客:红色石头的专栏
知乎:红色石头
微博:RedstoneWill的微博
GitHub:RedstoneWill的GitHub
微信公众号:AI有道(ID:redstonewill)
1. 什么是Softmax
Softmax 在机器学习和深度学习中有着非常广泛的应用。尤其在处理多分类(C > 2)问题,分类器最后的输出单元需要Softmax 函数进行数值处理。关于Softmax 函数的定义如下所示:
其中,Vi 是分类器前级输出单元的输出。i 表示类别索引,总的类别个数为 C。Si 表示的是当前元素的指数与所有元素指数和的比值。Softmax 将多分类的输出数值转化为相对概率,更容易理解和比较。我们来看下面这个例子。
一个多分类问题,C = 4。线性分类器模型最后输出层包含了四个输出值,分别是:
经过Softmax处理后,数值转化为相对概率:
很明显,Softmax 的输出表征了不同类别之间的相对概率。我们可以清晰地看出,S1 = 0.8390,对应的概率最大,则更清晰地可以判断预测为第1类的可能性更大。Softmax 将连续数值转化成相对概率,更有利于我们理解。
实际应用中,使用 Softmax 需要注意数值溢出的问题。因为有指数运算,如果 V 数值很大,经过指数运算后的数值往往可能有溢出的可能。所以,需要对 V 进行一些数值处理:即 V 中的每个元素减去 V 中的最大值。
相应的python示例代码如下:
scores = np.array([123, 456, 789])    # example with 3 classes and each having large scores
scores -= np.max(scores)    # scores becomes [-666, -333, 0]
p = np.exp(scores) / np.sum(np.exp(scores))
2. Softmax 损失函数
我们知道,线性分类器的输出是输入 x 与权重系数的矩阵相乘:s = Wx。对于多分类问题,使用 Softmax 对线性输出进行处理。这一小节我们来探讨下 Softmax 的损失函数。
其中,Syi是正确类别对应的线性得分函数,Si 是正确类别对应的 Softmax输出。
由于 log 运算符不会影响函数的单调性,我们对 Si 进行 log 操作:
我们希望 Si 越大越好,即正确类别对应的相对概率越大越好,那么就可以对 Si 前面加个负号,来表示损失函数:
对上式进一步处理,把指数约去:
这样,Softmax 的损失函数就转换成了简单的形式。
举个简单的例子,上一小节中得到的线性输出为:
假设 i = 1 为真实样本,计算其损失函数为:
3. Softmax 反向梯度
推导了 Softmax 的损失函数之后,接下来继续对权重参数进行反向求导。
Softmax 线性分类器中,线性输出为:
其中,下标 i 表示第 i 个样本。
求导过程的程序设计分为两种方法:一种是使用嵌套 for 循环,另一种是直接使用矩阵运算。
使用嵌套 for 循环,对权重 W 求导函数定义如下:
def softmax_loss_naive(W, X, y, reg):
 """
 Softmax loss function, naive implementation (with loops)

 Inputs have dimension D, there are C classes, and we operate on minibatches
 of N examples.

 Inputs:
 - W: A numpy array of shape (D, C) containing weights.
 - X: A numpy array of shape (N, D) containing a minibatch of data.
 - y: A numpy array of shape (N,) containing training labels; y[i] = c means
   that X[i] has label c, where 0 <= c < C.
 - reg: (float) regularization strength

 Returns a tuple of:
 - loss as single float
 - gradient with respect to weights W; an array of same shape as W
 """
 # Initialize the loss and gradient to zero.
 loss = 0.0
 dW = np.zeros_like(W)

 num_train = X.shape[0]
 num_classes = W.shape[1]
 for i in xrange(num_train):
   scores = X[i,:].dot(W)
   scores_shift = scores - np.max(scores)
   right_class = y[i]
   loss += -scores_shift[right_class] + np.log(np.sum(np.exp(scores_shift)))
   for j in xrange(num_classes):
     softmax_output = np.exp(scores_shift[j]) / np.sum(np.exp(scores_shift))
     if j == y[i]:
       dW[:,j] += (-1 + softmax_output) * X[i,:]
     else:
       dW[:,j] += softmax_output * X[i,:]

 loss /= num_train
 loss += 0.5 * reg * np.sum(W * W)
 dW /= num_train
 dW += reg * W

 return loss, dW
使用矩阵运算,对权重 W 求导函数定义如下:
def softmax_loss_vectorized(W, X, y, reg):
 """
 Softmax loss function, vectorized version.

 Inputs and outputs are the same as softmax_loss_naive.
 """
 # Initialize the loss and gradient to zero.
 loss = 0.0
 dW = np.zeros_like(W)

 num_train = X.shape[0]
 num_classes = W.shape[1]
 scores = X.dot(W)
 scores_shift = scores - np.max(scores, axis = 1).reshape(-1,1)
 softmax_output = np.exp(scores_shift) / np.sum(np.exp(scores_shift), axis=1).reshape(-1,1)
 loss = -np.sum(np.log(softmax_output[range(num_train), list(y)]))
 loss /= num_train
 loss += 0.5 * reg * np.sum(W * W)

 dS = softmax_output.copy()
 dS[range(num_train), list(y)] += -1
 dW = (X.T).dot(dS)
 dW = dW / num_train + reg * W

 return loss, dW
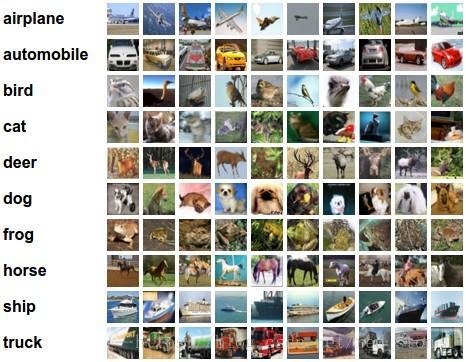
实际验证表明,矩阵运算速度要比嵌套循环快很多,特别是在训练样本数量多的情况下。我们使用 CIFAR-10 数据集中约5000个样本对两种求导方式进行测试对比:
tic = time.time()
loss_naive, grad_naive = softmax_loss_naive(W, X_train, y_train, 0.000005)
toc = time.time()
print('naive loss: %e computed in %fs' % (loss_naive, toc - tic))

tic = time.time()
loss_vectorized, grad_vectorized = softmax_loss_vectorized(W, X_train, y_train, 0.000005)
toc = time.time()
print('vectorized loss: %e computed in %fs' % (loss_vectorized, toc - tic))

grad_difference = np.linalg.norm(grad_naive - grad_vectorized, ord='fro')
print('Loss difference: %f' % np.abs(loss_naive - loss_vectorized))
print('Gradient difference: %f' % grad_difference)
结果显示为:
naive loss: 2.362135e+00 computed in 14.680000s
vectorized loss: 2.362135e+00 computed in 0.242000s
Loss difference: 0.000000
Gradient difference: 0.000000
显然,此例中矩阵运算的速度要比嵌套循环快60倍。所以,当我们在编写机器学习算法模型时,尽量使用矩阵运算,少用 嵌套循环,以提高运算速度。
4. Softmax 与 SVM
Softmax线性分类器的损失函数计算相对概率,又称交叉熵损失「Cross Entropy Loss」。线性 SVM 分类器和 Softmax 线性分类器的主要区别在于损失函数不同。SVM 使用 hinge loss,更关注分类正确样本和错误样本之间的距离「Δ = 1」,只要距离大于 Δ,就不在乎到底距离相差多少,忽略细节。而 Softmax 中每个类别的得分函数都会影响其损失函数的大小。举个例子来说明,类别个数 C = 3,两个样本的得分函数分别为[10, -10, -10],[10, 9, 9],真实标签为第0类。对于 SVM 来说,这两个 Li 都为0;但对于Softmax来说,这两个 Li 分别为0.00和0.55,差别很大。
关于 SVM 线性分类器,我在上篇文章里有所介绍,传送门:
基于线性SVM的CIFAR-10图像集分类
接下来,谈一下正则化参数 λ 对 Softmax 的影响。我们知道正则化的目的是限制权重参数 W 的大小,防止过拟合。正则化参数 λ 越大,对 W 的限制越大。例如,某3分类的线性输出为 [1, -2, 0],相应的 Softmax 输出为[0.7, 0.04, 0.26]。假设,正类类别是第0类,显然,0.7远大于0.04和0.26。
若使用正则化参数 λ,由于限制了 W 的大小,得到的线性输出也会等比例缩小:[0.5, -1, 0],相应的 Softmax 输出为[0.55, 0.12, 0.33]。显然,正确样本和错误样本之间的相对概率差距变小了。
也就是说,正则化参数 λ 越大,Softmax 各类别输出越接近。大的 λ 实际上是「均匀化」正确样本与错误样本之间的相对概率。但是,概率大小的相对顺序并没有改变,这点需要留意。因此,也不会影响到对 Loss 的优化算法。
5. Softmax 实际应用
使用 Softmax 线性分类器,对 CIFAR-10 图片集进行分类。
使用交叉验证,选择最佳的学习因子和正则化参数:
# Use the validation set to tune hyperparameters (regularization strength and
# learning rate). You should experiment with different ranges for the learning
# rates and regularization strengths; if you are careful you should be able to
# get a classification accuracy of over 0.35 on the validation set.
results = {}
best_val = -1
best_softmax = None
learning_rates = [1.4e-7, 1.5e-7, 1.6e-7]
regularization_strengths = [8000.0, 9000.0, 10000.0, 11000.0, 18000.0, 19000.0, 20000.0, 21000.0]

for lr in learning_rates:
   for reg in regularization_strengths:
       softmax = Softmax()
       loss = softmax.train(X_train, y_train, learning_rate=lr, reg=reg, num_iters=3000)
       y_train_pred = softmax.predict(X_train)
       training_accuracy = np.mean(y_train == y_train_pred)
       y_val_pred = softmax.predict(X_val)
       val_accuracy = np.mean(y_val == y_val_pred)
       if val_accuracy > best_val:
           best_val = val_accuracy
           best_softmax = softmax
       results[(lr, reg)] = training_accuracy, val_accuracy

# Print out results.
for lr, reg in sorted(results):
   train_accuracy, val_accuracy = results[(lr, reg)]
   print('lr %e reg %e train accuracy: %f val accuracy: %f' % (
               lr, reg, train_accuracy, val_accuracy))

print('best validation accuracy achieved during cross-validation: %f' % best_val)
训练结束后,在测试图片集上进行验证:
# evaluate on test set
# Evaluate the best softmax on test set
y_test_pred = best_softmax.predict(X_test)
test_accuracy = np.mean(y_test == y_test_pred)
print('softmax on raw pixels final test set accuracy: %f' % (test_accuracy, ))
softmax on raw pixels final test set accuracy: 0.386000
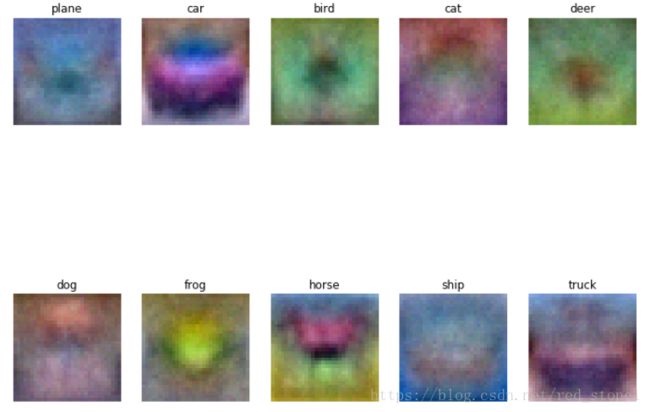
权重参数 W 可视化代码如下:
# Visualize the learned weights for each class
w = best_softmax.W[:-1,:] # strip out the bias
w = w.reshape(32, 32, 3, 10)

w_min, w_max = np.min(w), np.max(w)

classes = ['plane', 'car', 'bird', 'cat', 'deer', 'dog', 'frog', 'horse', 'ship', 'truck']
for i in range(10):
   plt.subplot(2, 5, i + 1)

   # Rescale the weights to be between 0 and 255
   wimg = 255.0 * (w[:, :, :, i].squeeze() - w_min) / (w_max - w_min)
   plt.imshow(wimg.astype('uint8'))
   plt.axis('off')
   plt.title(classes[i])
很明显,经过训练学习,W 包含了相应类别的某些简单色调和轮廓特征。
本文完整代码,点击「源码」获取。
源码
参考文献:
http://cs231n.github.io/linear-classify/


