elk+kafka+rsyslog+hadoop-hdfs+zookeeper搭建及其应用笔记
一:简述
本人之前搭建elk+redis架构收集日志,出现瓶颈,现使用新架构(els+kafka+rsyslog+hadoop-hdfs+zookeeper),解决方案。

二:搭建过程
A.rsyslogd服务
通过对 rsyslog官方文档 查看,得知 rsyslog对 kafka的支持是 v8.7.0版本后才提供的支持.通过 ChangeLog 也可以看出 V8.X的版本变化.
最新V8稳定版已经提供RPM包的Rsyslog-kafka插件了,直接yum安装即可,添加yum源:
[rsyslog_v8]
name=AdisconCentOS-$releasever - local packagesfor$basearch
baseurl=http://rpms.adiscon.com/v8-stable/epel-$releasever/$basearch
enabled=1
gpgcheck=0
gpgkey=http://rpms.adiscon.com/RPM-GPG-KEY-Adiscon
protect=1
yum remove -y rsyslog
添加后 yum install rsyslog rsyslog-kafka.x86_64即可完成安装。
增加一个将nginx access日志通过rsyslog传输到kafka的实例,将nginx_kafka.conf放入到/etc/rsyslog.d目录中,重启rsyslog即可。
# 加载omkafka和imfile模块
module(load="omkafka")
module(load="imfile")
# nginx templatetemplate(name="nginxAccessTemplate"type="string"string="%hostname%<-+>%syslogtag%<-+>%msg%\n")
# ruleset
ruleset(name="nginx-kafka") {
#日志转发kafka
action (
type="omkafka"template="nginxAccessTemplate"
confParam=["compression.codec=snappy","queue.buffering.max.messages=400000"]
partitions.number="4"
topic="test_nginx"
broker="10.120.169.149:9092"
queue.spoolDirectory="/tmp"
queue.filename="test_nginx_kafka"
queue.size="360000"
queue.maxdiskspace="2G"
queue.highwatermark="216000"
queue.discardmark="350000"
queue.type="LinkedList"
queue.dequeuebatchsize="4096"
queue.timeoutenqueue="0"
queue.maxfilesize="10M"
queue.saveonshutdown="on"
queue.workerThreads="4"
)
}
# 定义消息来源及设置相关的actioninput(type="imfile"Tag="nginx,aws"File="/var/log/access.log"Ruleset="nginx-kafka")
检查conf文件是否正确可以运行rsyslogd debug模式rsyslogd -dn运行,看日志输出结果,或者直接运行rsyslogd-N 1检查conf文件是否正确。
B.kafka + zookeeper搭建
1.简介
Apache Kafka 是一个高吞吐量分布式消息系统,由LinkedIn开源。引用官网对kafka的介绍:“ApacheKafka is publish-subscribe messaging rethought as a distributed commit log.” “publish-subscribe”是kafka设计的核心思想,也是kafka最具特色的地方。publish在kakfa中是一个producer的角色,subscribe是consumer,就像我们生活中的一样,生产商生产出来的产品,消费者一般不能够直接去工厂购买,还需要一个代理经销商,所以同样的在kafka的生态系统中,有一个broker的角色。所以kafka的生态系统大致可以表述如下:
"producer——>broker<——consumer"
wget http://www-eu.apache.org/dist/kafka/0.9.0.1/kafka_2.11-0.9.0.1.tgz
wget http://www-eu.apache.org/dist/zookeeper/zookeeper-3.4.6/zookeeper-3.4.6.tar.gz
Zookeeper 是 一个分布式。开放源码的分布式应用程序协调服务,是Google Chubby的一个开源实现,大多数的分布式应用都需要Zookeeper的支持,这篇文章先简单的和大家分享如何搭建一个zookeeper集群。(笔者注:Chubby是一个lockservice,通过这个lockservice可以解决分布式中的一致性问题。为这个lock service的实现是一个分布式的文件系统)。
2.zookeeperd
第一步: 安装 JDK/JRE
第二步:使用 "tar -xzvf zookeeper-3.4.6.tar.gz "来 解压安装包 :
解压后的目录结构:

第三步:修改zookeeper配置文件(集群和数据目录的配置)
使用“cp zoo_sample.cfg zoo.cfg”来创建一个zookeeper配置文件,在zoo.cfg中配置syncLimit,dataDir,clientPort,autopurge.purgeInterval,以及集群的server list:
vim zoo.cfg
#################################################
tickTime=2000
initLimit=10
syncLimit=5
dataDir=/data/zookeeper
clientPort=2181
autopurge.purgeInterval=1
server.101 = 10.10.70.101:2888:3888
server.102 = 10.10.70.102:2888:3888
server.103 = 10.10.70.103:2888:3888
server.104 = 10.10.70.104:2888:3888
server.105 = 10.10.70.105:2888:3888
server.106 = 10.10.70.106:2888:3888
server.107 = 10.10.70.107:2888:3888
server.108 = 10.10.70.108:2888:3888
############################################################
第四步:在配置集群的server中,分别找到zoo.cfg配置的dataDir目录,在目录下面添加一个“myid”的文件,把zoo.cfg配置的server list中的id值写入并保存:
[root@elk-new-101 zookeeper]# ls
myid version-2 zookeeper_server.pid
[root@elk-new-101 zookeeper]# cat myid
101
第八步:分别启动三台zookeeper,并检查集群状态:
使用 ./bin/zkServer.sh start 启动zookeeper,使用./bin/zkServer.sh status检查集群状态
[root@elk-new-101 zookeeper]# /usr/local/zookeeper/bin/zkServer.sh status
ZooKeeper JMX enabled by default
Using config: /usr/local/zookeeper/bin/../conf/zoo.cfg
Mode: follower
[root@elk-new-103 zookeeper]# /usr/local/zookeeper/bin/zkServer.sh status
ZooKeeper JMX enabled by default
Using config: /usr/local/zookeeper/bin/../conf/zoo.cfg
Mode: leader
mode显示了所在server在集群中所扮演的角色,每个server的角色不是固定的,leader是通过zookeeper的Fast Leader 选举算法产生,三台zookeeper集群就这么搭建好了,大家可以根据自己实际的项目需要再做一些详细的配置。
3.kafka搭建
第一步:使用 " tar -xzvf kafka_2.10-0.8.1.1.tgz "来 解压安装包 :
第二步 :修改配置文件
简答配置的话修改/config/server.properties 就可以了
需要配置的属性有:broker.id(标示当前server在集群中的id,从0开始),port,host.name(当前的serverhost name),zookeeper.connect(连接的zookeeper集群),log.dirs(log的存储目录,记得对应的去建立这个目录)等,其他的一些配置可以看相应的注释:
vim server.properties
#########################################################################################################################
broker.id=1
listeners=PLAINTEXT://:9092
#host.name=10.10.70.101
host.name=elk-new-101
num.network.threads=3
num.io.threads=8
socket.send.buffer.bytes=102400
socket.receive.buffer.bytes=102400
socket.request.max.bytes=104857600
log.dirs=/data/kafka-logs
num.partitions=1
num.recovery.threads.per.data.dir=1
log.retention.hours=168
log.segment.bytes=1073741824
log.retention.check.interval.ms=300000
zookeeper.connect=10.10.70.101:2181,10.10.70.102:2181,10.10.70.103:2181,10.10.70.104:2181,10.10.70.105:2181,10.10.70.106:2181,10.10.70.107:2181,10.10.70.108:2181
zookeeper.connection.timeout.ms=6000
#########################################################################################################################
第三步:通过“scp-r ”把配置好的kafka目录copy到其他几台server上:

第四步:修改每台server对应的配置文件,主要是修改其中的broker.id和 host.name 属性:
broker.id从0开始递增,每台server必须唯一
第五步: 先启动zookeeper集群,再启动kakfa集群
kafka启动命令: sudonohup ./bin/kafka-server-start.sh config/server.properties &
第六步:集群启动成功后,可以试着创建topic,在一台server上创建producer,另外一台创建consumer,从producer上发送信息,看consumer是否能接收到,以验证集群对否成功。
1. 创建topic:
./bin/kafka-topics.sh -create -zookeeper 10.10.70.101:2181,10.10.70.102:2181,10.10.70.103:2181,10.10.70.104:2181,10.10.70.105:2181,10.10.70.106:2181,10.10.70.107:2181,10.10.70.108:2181 -topic web-nginx -replication-factor 2 -partitions 6
2.查看topic
./bin/kafka-topics.sh -zookeeper 10.10.70.101:2181,10.10.70.102:2181,10.10.70.103:2181,10.10.70.104:2181,10.10.70.105:2181,10.10.70.106:2181,10.10.70.107:2181,10.10.70.108:2181 -list
3.创建producer
./bin/kafka-console-producer.sh -broker-list 10.10.70.101:9002,10.10.70.102:9002,10.10.70.103:9002,10.10.70.104:9002,10.10.70.105:9002,10.10.70.106:9002,10.10.70.107:9002,10.10.70.108:9002 -topic web-nginx
4.创建consumer
./bin/kafka-console-consumer.sh -zookeeper 10.10.70.101:2181,10.10.70.102:2181,10.10.70.103:2181,10.10.70.104:2181,10.10.70.105:2181,10.10.70.106:2181,10.10.70.107:2181,10.10.70.108:2181 --from-beginning -topic nginx
#############
通过在创建好的producer控制台输入信息,在consumer的控制台检测输出来测试,如果可以同步接受到信息就说明简单的kakfa 集群搭好了,另外可以根据项目的实际需求进一步做配置。
#############
5.给出一些命令。kill 启动和 删除 top的方法
删除topic
ps -ef |grep kafka |grep -v grep |awk '{print $2}' |xargs kill -9(集群节点同时进行)
#/usr/local/zookeeper/bin/zkCli.sh-server 10.10.70.101:2181,10.10.70.102:2181,10.10.70.103:2181,10.10.70.104:2181,10.10.70.105:2181,10.10.70.106:2181,10.10.70.107:2181,10.10.70.108:2181
ls /brokers/topics/web-nginx/partitions
delete /brokers/topics/005-web-nginx/partitions/0/state
delete /brokers/topics/005-web-nginx/partitions/1/state
delete /brokers/topics/005-web-nginx/partitions/2/state
delete /brokers/topics/005-web-nginx/partitions/3/state
delete /brokers/topics/005-web-nginx/partitions/4/state
delete /brokers/topics/005-web-nginx/partitions/5/state
delete /brokers/topics/005-web-nginx/partitions/0
delete /brokers/topics/005-web-nginx/partitions/1
delete /brokers/topics/005-web-nginx/partitions/2
delete /brokers/topics/005-web-nginx/partitions/3
delete /brokers/topics/005-web-nginx/partitions/4
delete /brokers/topics/005-web-nginx/partitions/5
delete /brokers/topics/005-web-nginx/partitions
delete /brokers/topics/005-web-nginx
ls /brokers/topics
出现 [] 则删除完成, 重启zookeeper
删除/data/kafka-logs/下的topic文件清空需要删除的topic的名字在replication-offset-checkpoint 和 recovery-point-offset-checkpoint 文件中
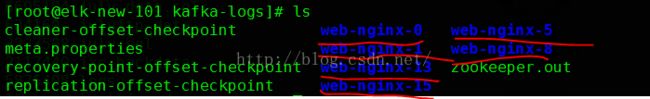
[root@elk-new-101 kafka-logs]# cat replication-offset-checkpoint
0
6
web-nginx 15 0
web-nginx 5 0
web-nginx 1 144166
web-nginx 0 144168
web-nginx 8 0
web-nginx 13 0
[root@elk-new-101 kafka-logs]# cat recovery-point-offset-checkpoint
0
6
web-nginx 15 0
web-nginx 5 0
web-nginx 1 0
web-nginx 0 0
web-nginx 8 0
web-nginx 13 0
C.elasticsearch部署
1.注意本文使用Elasticsearch 2.3.1来部署,2.0以后的版本不能用root启动。本人采用一台机器两个实例的方式,(注意2.0之前版本应该是要指定主节点的,2.0之后是随机生成主节点,还待考证)
2.新建用户及其home目录
useradd elk
vim .bash_profile
#####################################################
# .bash_profile
# Get the aliases and functions
if [ -f ~/.bashrc ]; then
. ~/.bashrc
fi
# User specific environment and startup programs
PATH=$PATH:$HOME/bin
export PATH
JAVA_HOME=/usr/local/jdk
CLASSPATH=.:$JAVA_HOME/lib/dt.jar:$JAVA_HOME/lib/tools.jar
PATH=$JAVA_HOME/bin:$PATH
export JAVA_HOME CLASSPATH PATH
######################################################
wget https://download.elastic.co/elasticsearch/release/org/elasticsearch/distribution/tar/elasticsearch/2.3.1/elasticsearch-2.3.1.tar.gz
并且重命名
[elk@elk-new-101 ~]$ ls
elasticsearch-1 elasticsearch-2
3. 直接配置
elasticsearch-1/config/elasticsearch.yml elasticsearch-2/config/elasticsearch.yml(后边会讲到hdfs搭建过程,repository 配置 最后一行配置必须要写。)
###############################################################################################################
cluster.name: xxxxx-elk-new
node.name: "elk-new-101-1"
network.host: 10.10.70.101
path.data: /data/elk
transport.tcp.port: 9300
transport.tcp.compress: true
http.port: 9200
discovery.zen.ping.unicast.hosts: ["10.10.70.101","10.10.70.102","10.10.70.103","10.10.70.104","10.10.70.105","10.10.70.106","10.10.70.107","10.10.70.108"]
index.number_of_shards: 10
index.number_of_replicas: 2
##@################# repository 配置##################
hdfs:
"uri" : "hdfs://xxxxx"
"path" : "/data/elk_hdfs"
"conf.hdfs_config" : "/usr/local/hadoop/etc/hadoop/hdfs-site.xml"
"conf.hadoop_config" : "/usr/local/hadoop/etc/hadoop/core-site.xml"
"load_defaults" : "true"
"compress" : "false"
"chunk_size" : "10mb"
security.manager.enabled: false
##################################################################################################################
vim elasticsearch-2/config/elasticsearch.yml (注意:端口不要写9201,会报错,注释掉即可,系统在启动第二个实例的时候自己分配端口并且9201 9202 9203 自己分配)
##################################################################################################################
cluster.name: xxxxxxxx-elk-new
node.name: "elk-new-101-2"
network.host: 10.10.70.101
path.data: /data/elk
#transport.tcp.port: 9301
#http.port: 9201
discovery.zen.ping.unicast.hosts: ["10.10.70.101","10.10.70.102","10.10.70.103","10.10.70.104","10.10.70.105","10.10.70.106","10.10.70.107","10.10.70.108"]
index.number_of_shards: 10
index.number_of_replicas: 2
##@################# repository 配置##################
hdfs:
"uri" : "hdfs://xxxxxxxx"
"path" : "/data/elk_hdfs"
"conf.hdfs_config" : "/usr/local/hadoop/etc/hadoop/hdfs-site.xml"
"conf.hadoop_config" : "/usr/local/hadoop/etc/hadoop/core-site.xml"
"load_defaults" : "true"
"compress" : "false"
"chunk_size" : "10mb"
security.manager.enabled: false
####################################################################################################################
4.插件安装。安装几个比较实用的插件,方便管理(因为网络问题我的机器上不了网,所有采用离线下载的方式,有网的就用命令装吧)
[elk@elk-new-101 plugins]$ pwd
/home/elk/elasticsearch-1/plugins
[elk@elk-new-101 plugins]$ ll
总用量 12
drwxr-xr-x. 6 elk elk 4096 4月 14 09:19 head
drwxrwxr-x 8 elk elk 4096 4月 24 12:43 kopf
drwxrwxr-x 4 elk elk 4096 4月 24 12:44 repository-hdfs
安装(提醒下es 是2.3的所以ElasticSearch-Bigdesk插件不能用)
ElasticSearch-Head
- elasticsearch/bin/plugin install mobz/elasticsearch-head
- 手动安装
先到github下载文件 elasticsearch-head-master.zip
然后通过指定文件路径来安装
⇒ sudo ./plugin installfile:///Users/Richard/Downloads/elasticsearch-head-master.zip

在2.x之前版本的命令行格式为:
bin/plugin--install head --url file:///Full/Path/To/elasticsearch-head-master.zip
ElasticSearch-Kopf
Kopf是一个ElasticSearch的管理工具,它也提供了对ES集群操作的API。

安装
./elasticsearch/bin/plugininstall lmenezes/elasticsearch-kopf/{branch|version}
open http://localhost:9200/_plugin/kopf
版本支持
-----------------------------------------------------------
elasticsearch | version branch | latest version
-----------------------------------------------------------0.90.X | 0.90 | v0.90
----------------------------------------------------------- 1.X | 1.0 | v1.6.1
-----------------------------------------------------------
2.X | 2.0 | v2.1.1
-----------------------------------------------------------
ElasticSearch-Bigdesk
Bigdesk为Elastic集群提供动态的图表与统计数据。

Bigdesk目前只支持到ElasticSearch1.3.x
-----------------------------------------------------------
Bigdesk | Elasticsearch
-----------------------------------------------------------
2.5.0 | 1.3.0 ... 1.3.x
-----------------------------------------------------------
2.4.1 (2.4.0) | 1.0.0.RC1 ... 1.2.x
----------------------------------------------------------- n/a | 1.0.0.Beta1 ... 1.0.0.Beta2
----------------------------------------------------------- 2.2.3 | 0.90.10 ... 0.90.x
----------------------------------------------------------- 2.2.2 (2.2.1) | 0.90.0 ... 0.90.9
----------------------------------------------------------- 2.1.0 | 0.20.0 ... 0.20.x
----------------------------------------------------------- 2.0.0 | 0.19.0 ... 0.20.x
----------------------------------------------------------- 1.0.0 | 0.17.0 ... 0.18.x
-----------------------------------------------------------
HDFS 插件安装配置
下载repository-hdfs插件,通过标准的elasticsearch plugin 安装命令安装:
bin/plugin installelasticsearch/elasticsearch-repository-hdfs/2.3.1
然后在 elasticsearch.yml 中增加以下配置:
# repository 配置
hdfs:
uri:"hdfs://
#Hadoopfile-system URI
path:"some/path"
#path withthe file-system where data is stored/loaded
conf.hdfs_config:"/hadoop/hadoop-2.5.2/etc/hadoop/hdfs-site.xml"
conf.hadoop_config:"/hadoop/hadoop-2.5.2/etc/hadoop/core-site.xml"
load_defaults:"true"
#whether toload the default Hadoop configuration (default) or not
compress:"false"
# optional -whether to compress the metadata or not (default)
chunk_size:"10mb"
# optional -chunk size (disabled by default)
# 禁用 jsm
security.manager.enabled: false
默认情况下,Elasticsearch 为了安全考虑会在运行JVM 的时候执行 JSM。出于 Hadoop 和 HDFS 客户端权限问题,所以需要禁用 JSM。将 elasticsearch.yml 中的 security.manager.enabled 设置为false。
将插件安装好,配置修改完毕后,需要重启 Elasticsearch 服务。没有重启节点插件可能会执行失败。
注意:Elasticsearch 集群的每个节点都要执行以上步骤!
5.启动(注意:先启动写端口的实例,如9200,等启动起来再启动别的实例 如9201)
sudo -u elk /home/elk/elasticsearch-1/bin/elasticsearch &
sudo -u elk /home/elk/elasticsearch-2/bin/elasticsearch &
ps -ef |grep elasticsearch
##########################################################################
elk 12092 1 4 09:44 pts/2 00:23:11 /usr/local/jdk/bin/java -Xms3g -Xmx3g -Djava.awt.headless=true -XX:+UseParNewGC -XX:+UseConcMarkSweepGC -XX:CMSInitiatingOccupancyFraction=75 -XX:+UseCMSInitiatingOccupancyOnly -XX:+HeapDumpOnOutOfMemoryError -XX:+DisableExplicitGC -Dfile.encoding=UTF-8 -Djna.nosys=true -Des.path.home=/home/elk/elasticsearch-1 -cp /home/elk/elasticsearch-1/lib/elasticsearch-2.3.1.jar:/home/elk/elasticsearch-1/lib/* org.elasticsearch.bootstrap.Elasticsearch start
elk 12196 1 4 09:44 pts/2 00:20:27 /usr/local/jdk/bin/java -Xms3g -Xmx3g -Djava.awt.headless=true -XX:+UseParNewGC -XX:+UseConcMarkSweepGC -XX:CMSInitiatingOccupancyFraction=75 -XX:+UseCMSInitiatingOccupancyOnly -XX:+HeapDumpOnOutOfMemoryError -XX:+DisableExplicitGC -Dfile.encoding=UTF-8 -Djna.nosys=true -Des.path.home=/home/elk/elasticsearch-2 -cp /home/elk/elasticsearch-2/lib/elasticsearch-2.3.1.jar:/home/elk/elasticsearch-2/lib/* org.elasticsearch.bootstrap.Elasticsearch start
############################################################################
D.logstash的安装部署
1.使用Logstash 2.3.1
wget https://download.elastic.co/logstash/logstash/logstash-2.3.1.tar.gz
vim logstash_kafka.conf
input {
kafka {
zk_connect => "10.10.70.101:2181,10.10.70.102:2181,10.10.70.103:2181,10.10.70.104:2181,10.10.70.105:2181,10.10.70.106:2181,10.10.70.107:2181,10.10.70.108:2181"
topic_id => "web-nginx"
#group_id => "logstash"
#rebalance_backoff_ms => 5000
#rebalance_max_retries => 50
#reset_beginning => false
#consumer_threads => 3
}
}
output {
#stdout { codec => rubydebug }
elasticsearch {
hosts => ["10.10.70.101","10.10.70.102","10.10.70.103","10.10.70.104","10.10.70.105","10.10.70.106","10.10.70.107","10.10.70.108"]
manage_template => true
template => "/usr/local/logstash/etc/elasticsearch-template.josn"
template_name => "logstash"
template_overwrite => true
index => "logstash-%{+YYYY.MM.dd}"
}
}
vim elasticsearch-template.json (具体用法可以看下官方文档,我也不太明白json的格式,希望朋友可以一起探讨, 以上 配置中 的template => "/usr/local/logstash/etc/elasticsearch-template.josn"为此功能设计,后期研究明白再说哈)
###################################只做分割线,别复制#######################################
{
"template" : "logstash-*",
"settings" : {
"index.refresh_interval" : "5s"
},
"mappings" : {
"_default_" : {
"_all" : {"enabled" : true, "omit_norms" : true},
"dynamic_templates" : [ {
"message_field" : {
"match" : "message",
"match_mapping_type" : "string",
"mapping" : {
"type" : "string", "index" : "analyzed", "omit_norms" : true
}
}
}, {
"string_fields" : {
"match" : "*",
"match_mapping_type" : "string",
"mapping" : {
"type" : "string", "index" : "analyzed", "omit_norms" : true,
"fields" : {
"raw" : {"type": "string", "index" : "not_analyzed", "ignore_above" : 256}
}
}
}
}, {
"float_fields" : {
"match" : "*",
"match_mapping_type" : "float",
"mapping" : { "type" : "float", "index" : "analyzed" }
}
}, {
"double_fields" : {
"match" : "*",
"match_mapping_type" : "double",
"mapping" : { "type" : "double", "index" : "analyzed" }
}
}, {
"integer_fields" : {
"match" : "*",
"match_mapping_type" : "integer",
"mapping" : { "type" : "integer", "index" : "analyzed" }
}
} ],
"properties" : {
"@version": { "type": "string", "index": "not_analyzed" },
"geoip" : {
"type" : "object",
"dynamic": true,
"properties" : {
"location" : { "type" : "geo_point" }
}
}
}
}
}
}
###################################只做分割线,别复制#######################################
2.启动
/usr/local/logstash/bin/logstash -f /usr/local/logstash/etc/logstash_kafka.conf &
E.hadoop 集群搭建
1.原理分析
HDFS(Hadoop Distributed File System )Hadoop分布式文件系统。
HDFS有很多特点:
① 保存多个副本,且提供容错机制,副本丢失或宕机自动恢复。默认存3份。
② 运行在廉价的机器上。
③ 适合大数据的处理。多大?多小?HDFS默认会将文件分割成block,64M为1个block。然后将block按键值对存储在HDFS上,并将键值对的映射存到内存中。如果小文件太多,那内存的负担会很重。

如上图所示,HDFS也是按照Master和Slave的结构。分NameNode、SecondaryNameNode、DataNode这几个角色。
NameNode:是Master节点,是大领导。管理数据块映射;处理客户端的读写请求;配置副本策略;管理HDFS的名称空间;
SecondaryNameNode:是一个小弟,分担大哥namenode的工作量;是NameNode的冷备份;合并fsimage和fsedits然后再发给namenode。
DataNode:Slave节点,奴隶,干活的。负责存储client发来的数据块block;执行数据块的读写操作。
热备份:b是a的热备份,如果a坏掉。那么b马上运行代替a的工作。
冷备份:b是a的冷备份,如果a坏掉。那么b不能马上代替a工作。但是b上存储a的一些信息,减少a坏掉之后的损失。
fsimage:元数据镜像文件(文件系统的目录树。)
edits:元数据的操作日志(针对文件系统做的修改操作记录)
namenode内存中存储的是=fsimage+edits。
SecondaryNameNode负责定时默认1小时,从namenode上,获取fsimage和edits来进行合并,然后再发送给namenode。减少namenode的工作量。
工作原理
写操作:

有一个文件FileA,100M大小。Client将FileA写入到HDFS上。
HDFS按默认配置。
HDFS分布在三个机架上Rack1,Rack2,Rack3。
a. Client将FileA按64M分块。分成两块,block1和Block2;
b. Client向nameNode发送写数据请求,如图蓝色虚线①------>。
c. NameNode节点,记录block信息。并返回可用的DataNode,如粉色虚线②--------->。
Block1: host2,host1,host3
Block2: host7,host8,host4
原理:
NameNode具有RackAware机架感知功能,这个可以配置。
若client为DataNode节点,那存储block时,规则为:副本1,同client的节点上;副本2,不同机架节点上;副本3,同第二个副本机架的另一个节点上;其他副本随机挑选。
若client不为DataNode节点,那存储block时,规则为:副本1,随机选择一个节点上;副本2,不同副本1,机架上;副本3,同副本2相同的另一个节点上;其他副本随机挑选。
d. client向DataNode发送block1;发送过程是以流式写入。
流式写入过程,
1>将64M的block1按64k的package划分;
2>然后将第一个package发送给host2;
3>host2接收完后,将第一个package发送给host1,同时client想host2发送第二个package;
4>host1接收完第一个package后,发送给host3,同时接收host2发来的第二个package。
5>以此类推,如图红线实线所示,直到将block1发送完毕。
6>host2,host1,host3向NameNode,host2向Client发送通知,说“消息发送完了”。如图粉红颜色实线所示。
7>client收到host2发来的消息后,向namenode发送消息,说我写完了。这样就真完成了。如图黄色粗实线
8>发送完block1后,再向host7,host8,host4发送block2,如图蓝色实线所示。
9>发送完block2后,host7,host8,host4向NameNode,host7向Client发送通知,如图浅绿色实线所示。
10>client向NameNode发送消息,说我写完了,如图黄色粗实线。。。这样就完毕了。
分析,通过写过程,我们可以了解到:
①写1T文件,我们需要3T的存储,3T的网络流量贷款。
②在执行读或写的过程中,NameNode和DataNode通过HeartBeat进行保存通信,确定DataNode活着。如果发现DataNode死掉了,就将死掉的DataNode上的数据,放到其他节点去。读取时,要读其他节点去。
③挂掉一个节点,没关系,还有其他节点可以备份;甚至,挂掉某一个机架,也没关系;其他机架上,也有备份。
读操作:
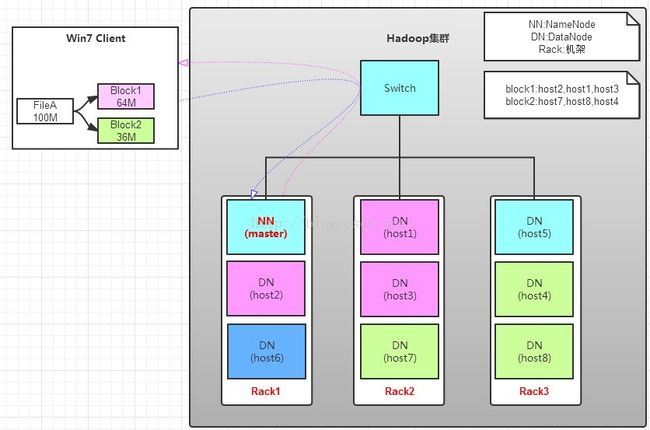
读操作就简单一些了,如图所示,client要从datanode上,读取FileA。而FileA由block1和block2组成。
那么,读操作流程为:
a. client向namenode发送读请求。
b. namenode查看Metadata信息,返回fileA的block的位置。
block1:host2,host1,host3
block2:host7,host8,host4
c. block的位置是有先后顺序的,先读block1,再读block2。而且block1去host2上读取;然后block2,去host7上读取;
上面例子中,client位于机架外,那么如果client位于机架内某个DataNode上,例如,client是host6。那么读取的时候,遵循的规律是:
优选读取本机架上的数据。
2.HDFS中常用到的命令端口等
常用的端口配置
HDFS端口
| 参数 |
描述 |
默认 |
配置文件 |
例子值 |
| fs.default.name |
namenode RPC交互端口 |
8020 |
core-site.xml |
hdfs://master:8020/ |
| dfs.http.address |
NameNode web管理端口 |
50070 |
hdfs-site.xml |
0.0.0.0:50070 |
| dfs.datanode.address |
datanode 控制端口 |
50010 |
hdfs-site.xml |
0.0.0.0:50010 |
| dfs.datanode.ipc.address |
datanode的RPC服务器地址和端口 |
50020 |
hdfs-site.xml |
0.0.0.0:50020 |
| dfs.datanode.http.address |
datanode的HTTP服务器和端口 |
50075 |
hdfs-site.xml |
0.0.0.0:50075 |
MR端口
| 参数 |
描述 |
默认 |
配置文件 |
例子值 |
| mapred.job.tracker |
job tracker交互端口 |
8021 |
mapred-site.xml |
hdfs://master:8021/ |
| mapred.job.tracker.http.address |
job tracker的web管理端口 |
50030 |
mapred-site.xml |
0.0.0.0:50030 |
| mapred.task.tracker.http.address |
task tracker的HTTP端口 |
50060 |
mapred-site.xml |
0.0.0.0:50060 |
其他端口
| 参数 |
描述 |
默认 |
配置文件 |
例子值 |
| dfs.secondary.http.address |
secondary NameNode web管理端口 |
50090 |
hdfs-site.xml |
0.0.0.0:28680 |
集群目录配置
| 参数 |
描述 |
默认 |
配置文件 |
例子值 |
| dfs.name.dir |
name node的元数据,以,号隔开,hdfs会把元数据冗余复制到这些目录,一般这些目录是不同的块设备,不存在的目录会被忽略掉 |
{hadoop.tmp.dir} /dfs/name |
hdfs-site.xm |
/hadoop/hdfs/name |
| dfs.name.edits.dir |
node node的事务文件存储的目录,以,号隔开,hdfs会把事务文件冗余复制到这些目录,一般这些目录是不同的块设备,不存在的目录会被忽略掉 |
${dfs.name.dir} |
hdfs-site.xm |
${dfs.name.dir} |
| fs.checkpoint.dir |
secondary NameNode的元数据以,号隔开,hdfs会把元数据冗余复制到这些目录,一般这些目录是不同的块设备,不存在的目录会被忽略掉 |
${hadoop.tmp.dir} /dfs/namesecondary |
core-site.xml |
/hadoop/hdfs/namesecondary |
| fs.checkpoint.edits.dir |
secondary NameNode的事务文件存储的目录,以,号隔开,hdfs会把事务文件冗余复制到这些目录 |
${fs.checkpoint.dir} |
core-site.xml |
${fs.checkpoint.dir} |
| hadoop.tmp.dir |
临时目录,其他临时目录的父目录 |
/tmp/hadoop-${user.name} |
core-site.xml |
/hadoop/tmp/hadoop-${user.name} |
| dfs.data.dir |
data node的数据目录,以,号隔开,hdfs会把数据存在这些目录下,一般这些目录是不同的块设备,不存在的目录会被忽略掉 |
${hadoop.tmp.dir} /dfs/data |
hdfs-site.xm |
/hadoop/hdfs/data1/data, /hadoop/hdfs/data2/data |
| mapred.local.dir |
MapReduce产生的中间数据存放目录,以,号隔开,hdfs会把数据存在这些目录下,一般这些目录是不同的块设备,不存在的目录会被忽略掉 |
${hadoop.tmp.dir} /mapred/local |
mapred-site.xml |
/hadoop/hdfs/data1/mapred/local, /hadoop/hdfs/data2/mapred/local |
| mapred.system.dir |
MapReduce的控制文件 |
${hadoop.tmp.dir} /mapred/system |
mapred-site.xml |
/hadoop/hdfs/data1/system |
其他配置
| 参数 |
描述 |
默认 |
配置文件 |
例子值 |
| dfs.support.append |
支持文件append,主要是支持hbase |
false |
hdfs-site.xml |
true |
| dfs.replication |
文件复制的副本数,如果创建时不指定这个参数,就使用这个默认值作为复制的副本数 |
3 |
hdfs-site.xml |
2 |
3.部署过程
a.配置hosts (所有节点需要操作)
10.10.70.101 elk-new-101
10.10.70.102 elk-new-102
10.10.70.103 elk-new-103
10.10.70.104 elk-new-104
10.10.70.105 elk-new-105
10.10.70.106 elk-new-106
10.10.70.107 elk-new-107
10.10.70.108 elk-new-108
b.配置时钟同步
c.下载 wget http://www-eu.apache.org/dist/hadoop/common/hadoop-2.7.2/hadoop-2.7.2-src.tar.gz
[root@elk-new-101 hadoop]# pwd
/usr/local/hadoop/etc/hadoop
1.core-site.xml 2.hdfs-site.xml 3.yarn-site.xml 4.mapred-site.xml
vim core-site.xml
##################
##################
[root@elk-new-101 hadoop]# cat hdfs-site.xml
######################################################################
###########################################################################################
[root@elk-new-101 hadoop]# cat yarn-site.xml
###########################################################################################
###########################################################################################
[root@elk-new-101 hadoop]# cat mapred-site.xml
###########################################################################################
###########################################################################################
4.启动过程
nn1
./sbin/start-dfs.sh
./sbin/stop-dfs.sh
nn1
nn2
/usr/local/hadoop/sbin/hadoop-daemon.sh start namenode
/usr/local/hadoop/sbin/hadoop-daemon.sh stop namenode
nn2
hdfs namenode -bootstrapStandby
nn1
nn2
./sbin/start-yarn.sh
./sbin/stop-yarn.sh
nn1
nn2
./sbin/mr-jobhistory-daemon.sh start historyserver
./sbin/mr-jobhistory-daemon.sh stop historyserver
5.查看状态
./bin/hdfs haadmin -getServiceState nn1
./bin/hdfs haadmin -getServiceState nn2
./bin/yarn rmadmin -getServiceState rm1
./bin/yarn rmadmin -getServiceState rm2
6.备份过程
a.直接用curl法:
curl -XPUT 'http://localhost:9200/_snapshot/backup' -d '{
"type":"hdfs",
"settings": {
"uri":"hdfs://hadoop:8020",
"path":"/test/es",
"conf_location": "hdfs-site.xml"
}
}'
返回 {"acknowledged":true} 表示创建成功.
查看创建的配置:
curl http://localhost:9200/_snapshot/_all
可以看到返回刚才配置信息.
测试备份数据
curl -XPUT "localhost:9200/_snapshot/backup/snapshot_1?wait_for_completion=true"
尝试去看下HDFS上是否有刚才备份的文件,访问 http://hadoop:50070/explorer.html#/test/es 便可以看到相关的快照文件.
测试还原数据
通过快照还原数据,测试前可以把之前测试做过备份的索引进行删除,然后通过如下命令进行数据恢复:
curl -XPOST "localhost:9200/_snapshot/backup/snapshot_1/_restore?wait_for_completion=true"
- See more at: http://bigbo.github.io/pages/2015/02/28/elasticsearch_hadoop/#sthash.rbCAuutb.dpuf
b.用图像法:(方法很简单,先建立,后恢复)

F.kibana搭建配置 (可根据自己的需要 建立1个或者多个每个配置只需更改端口ip即可,4.3貌似出来了可以设置权限的问题了,我还没有研究,有兴趣可以自己研究下)
1.两种方式安装
- Download and install the Public Signing Key:
wget -qO - https://packages.elastic.co/GPG-KEY-elasticsearch| sudo apt-key add -
- Add the repository definition to your /etc/apt/sources.list.d/kibana.list file:
echo "debhttp://packages.elastic.co/kibana/4.5/debian stable main" | sudo tee -a /etc/apt/sources.list
Use the echo method described above to addthe Kibana repository. Do not use add-apt-repository, as thatcommand adds a deb-src entry with no correspondingsource package. When the deb-src entry, is present, the commandsin this procedure generate an error similar to the following:
Unable to findexpected entry 'main/source/Sources' in Release file (Wrong sources.list entryor malformed file)
Delete the deb-src entry from the /etc/apt/sources.list.d/kibana.list file toclear the error.
- Run apt-get update and the repository is ready for use. Install Kibana with the following command:
sudo apt-get update && sudo apt-get installkibana
wget https://download.elastic.co/kibana/kibana/kibana-4.5.0-linux-x64.tar.gz
[root@elk-new-101 config]# cat kibana.yml
# Kibana is served by a back end server. This controls which port to use.
server.port: 8080
# The host to bind the server to.
# server.host: "0.0.0.0"
server.host: "10.10.70.101"
# If you are running kibana behind a proxy, and want to mount it at a path,
# specify that path here. The basePath can't end in a slash.
# server.basePath: ""
# The maximum payload size in bytes on incoming server requests.
# server.maxPayloadBytes: 1048576
# The Elasticsearch instance to use for all your queries.
# elasticsearch.url: "http://localhost:9200"
elasticsearch.url: "http://10.10.70.101:9200"
# preserve_elasticsearch_host true will send the hostname specified in `elasticsearch`. If you set it to false,
# then the host you use to connect to *this* Kibana instance will be sent.
# elasticsearch.preserveHost: true
# Kibana uses an index in Elasticsearch to store saved searches, visualizations
# and dashboards. It will create a new index if it doesn't already exist.
# kibana.index: ".kibana"
# The default application to load.
# kibana.defaultAppId: "discover"
# If your Elasticsearch is protected with basic auth, these are the user credentials
# used by the Kibana server to perform maintenance on the kibana_index at startup. Your Kibana
# users will still need to authenticate with Elasticsearch (which is proxied through
# the Kibana server)
# elasticsearch.username: "user"
# elasticsearch.password: "pass"
# SSL for outgoing requests from the Kibana Server to the browser (PEM formatted)
# server.ssl.cert: /path/to/your/server.crt
# server.ssl.key: /path/to/your/server.key
# Optional setting to validate that your Elasticsearch backend uses the same key files (PEM formatted)
# elasticsearch.ssl.cert: /path/to/your/client.crt
# elasticsearch.ssl.key: /path/to/your/client.key
# If you need to provide a CA certificate for your Elasticsearch instance, put
# the path of the pem file here.
# elasticsearch.ssl.ca: /path/to/your/CA.pem
# Set to false to have a complete disregard for the validity of the SSL
# certificate.
# elasticsearch.ssl.verify: true
# Time in milliseconds to wait for elasticsearch to respond to pings, defaults to
# request_timeout setting
# elasticsearch.pingTimeout: 1500
# Time in milliseconds to wait for responses from the back end or elasticsearch.
# This must be > 0
# elasticsearch.requestTimeout: 30000
# Time in milliseconds for Elasticsearch to wait for responses from shards.
# Set to 0 to disable.
# elasticsearch.shardTimeout: 0
# Time in milliseconds to wait for Elasticsearch at Kibana startup before retrying
# elasticsearch.startupTimeout: 5000
# Set the path to where you would like the process id file to be created.
# pid.file: /var/run/kibana.pid
# If you would like to send the log output to a file you can set the path below.
# logging.dest: stdout
# Set this to true to suppress all logging output.
# logging.silent: false
# Set this to true to suppress all logging output except for error messages.
# logging.quiet: false
# Set this to true to log all events, including system usage information and all requests.
# logging.verbose: false
##以上就是全过程了,有问题可以留言进行探讨