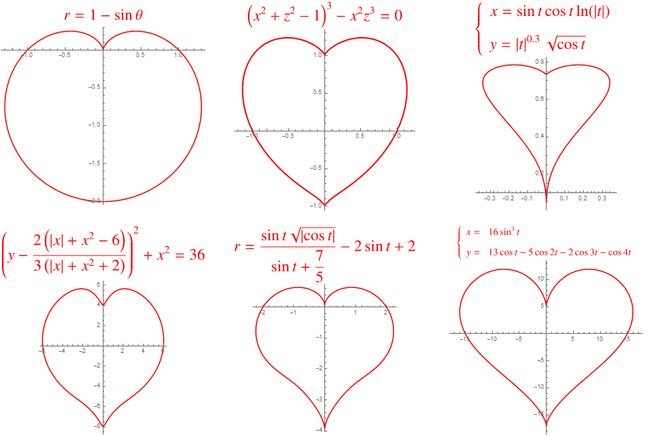
一些心型曲线及其方程
来源
http://mathworld.wolfram.com/HeartCurve.html
原始代码:
http://mathworld.wolfram.com/notebooks/PlaneCurves/HeartCurve.nb
代码修改
用MaTeX对代码中标签和公式作修改。
<< MaTeX`

Block[{style=9},GraphicsGrid[Partition[{

PolarPlot[1-Sin[t],{t,0,2\[Pi]},PlotStyle->Red,PlotLabel->Evaluate@(MaTeX[#,Magnification->2,"Preamble"->{"\\usepackage{amsmath,amssymb}","\\usepackage{color,txfonts}"}]&@"\\color{red}r=1-\\sin\\theta"),BaseStyle->style],

ContourPlot[-x^2 z^3+(-1+x^2+z^2)^3,{x,-1.2,1.2},{z,-1,1.3},Contours->{0},ContourShading->False,Frame->False,PlotLabel->Evaluate@(MaTeX[#,Magnification->2,"Preamble"->{"\\usepackage{amsmath,amssymb}","\\usepackage{color,txfonts}"}]&@"\\color{red}\\left(x^2+z^2-1\\right)^3-x^2 z^3=0"),ContourStyle->Directive[Opacity[1],Red,Thickness[.0075]],Axes->True,BaseStyle->style],

ParametricPlot[{Log[Abs[t]]Sin[t]Cos[t],Abs[t]^.3Sqrt[Cos[t]]},{t,-1,1},AspectRatio->Automatic,BaseStyle->style,PlotPoints->100,PlotStyle->Red,PlotRange->All,PlotLabel-> Evaluate@(MaTeX[#,Magnification->2,"Preamble"->{"\\usepackage{amsmath,amssymb}","\\usepackage{color,txfonts}"}]&@"\\color{red}\\left\\{\\begin{array}{l}
x=\\sin{t}\\cos{t}\\ln(\\left|t\\right|)\\\\[10pt]
y=\\left|t\\right|^{0.3}\\sqrt{\\cos{t}}\\\\
\\end{array}\\right.")],

Plot[2/3((x^2+Abs[x]-6)/(x^2+Abs[x]+2))+# (36-x^2)^(1/2)&/@{-1,1},{x,-6,6},PlotStyle->Red,BaseStyle->style,AspectRatio->Automatic,PlotLabel-> Evaluate@(MaTeX[#,Magnification->2,"Preamble"->{"\\usepackage{amsmath,amssymb}","\\usepackage{color,txfonts}"}]&@"\\color{red}\\left(y-\\frac{2\\left(\\left|x\\right|+x^2-6\\right)}{3\\left(\\left|x\\right|+x^2+2\\right)}\\right)^2+x^2=36")],

PolarPlot[2-2Sin[t]+Sin[t] Sqrt[Abs[Cos[t]]]/(Sin[t]+7/5),{t,0,2\[Pi]},PlotStyle->Red,PlotLabel->Evaluate@(MaTeX[#,Magnification->2,"Preamble"->{"\\usepackage{amsmath,amssymb}","\\usepackage{color,txfonts}"}]&@"\\color{red}
r=\\frac{\\sin{t}\\sqrt{\\left|\\cos{t}\\right|}}{\\sin{t}+\\dfrac{7}{5}}-2\\sin{t}+2"),BaseStyle->style],

ParametricPlot[par={16 Sin[t]^3,13 Cos[t]-5 Cos[2 t]-2 Cos[3 t]-Cos[4 t]},{t,-\[Pi],\[Pi]},AspectRatio->Automatic,BaseStyle->style,PlotPoints->100,PlotStyle->Red,PlotRange->All,PlotLabel->Evaluate@(MaTeX[#,Magnification->1.25,"Preamble"->{"\\usepackage{amsmath,amssymb}","\\usepackage{color,txfonts}"}]&@"\\color{red}\\left\\{\\begin{array}{rl}
x=&16\\sin^3t\\\\[10pt]
y=&13\\cos{t}-5\\cos{2t}-2\\cos{3t}-\\cos{4t}\\\\
\\end{array}\\right.")]},3,3,{1,1},{}],ImageSize->980]]
输出