[数字图像处理]灰度变换——反转,对数变换,伽马变换,灰度拉伸,灰度切割,位图切割
灰度变换,属于一个非常重要的概念。这里主要参考《Digital Image Processing》 Rafael C. Gonzalez / Richard E. Woods 的第三章。书中所有的实验与数学式都采用了8-bit 图像的灰度范围,也就是0到255这样一个范围,这是本书不合理的一个地方。首先,这样做并不泛用,图片不一定是8-bit的。其次,在做某些变换的时候,可能会导致溢出。比如,伽马变化,假设伽马值为2,那么灰度为255的像素点,其变换之后值为65025,这里就溢出了。当然,要是使用Matlab计算,肯定会处理的非常好,直接使用mat2gray函数就能将其压缩回0到255。但是要是其他嵌入式平台处理的时候,直接套用不方便不说,直接按照8-bit的图来理解很不直观。因此,我将数学式做了改变,让其输入为0到1的浮点数,其输出也是0到1的浮点数,这样方便理解。
本文所使用的图片,均来源于《Digital Image Processing》的主页 http://www.imageprocessingplace.com/
图像反转
图像反转,这个翻译还是很不恰当的。这里应该理解为负片变换,负片变换如下所示。
负片变换,主要用于观察过黑的图片,负片变换之后,方便观察。很简单的变换。
对数变换
对数变换主要用于将图像的低灰度值部分扩展,将其高灰度值部分压缩,以达到强调图像低灰度部分的目的。变换方法由下式给出。
这里的对数变换,底数为 ,实际计算的时候,需要用换底公式。其输入为
 ,其输出也为
 。对于不同的底数,其对应的变换曲线如下图所示。
底数越大,对低灰度部分的强调就越强,对高灰度部分的压缩也就越强。相反的,如果想强调高灰度部分,则用反对数函数就可以了。看下面的实验就可以很直观的理解,下图是某图像的二维傅里叶变换图像,其为了使其灰度部分较为明显,一般都会使用灰度变换处理一下。
实现对数变换的Matlab代码如下:
close all;
clear all;

%% -------------Log Transformations-----------------
f = imread('DFT_no_log.tif');
f = mat2gray(f,[0 255]);

v = 10;
g_1 = log2(1 + v*f)/log2(v+1);

v = 30;
g_2 = log2(1 + v*f)/log2(v+1);

v = 200;
g_3 = log2(1 + v*f)/log2(v+1);

figure();
subplot(1,2,1);
imshow(f,[0 1]);
xlabel('a).Original Image');
subplot(1,2,2);
imshow(g_1,[0 1]);
xlabel('b).Log Transformations v=10');

figure();
subplot(1,2,1);
imshow(g_2,[0 1]);
xlabel('c).Log Transformations v=100');

subplot(1,2,2);
imshow(g_3,[0 1]);
xlabel('d).Log Transformations v=200');
伽马变换
伽马变换主要用于图像的校正,将漂白的图片或者是过黑的图片,进行修正。伽马变换也常常用于显示屏的校正,这是一个非常常用的变换。其变化所用数学式如下所示,
其输入为 ,其输出也为
 。对于不同的伽马值,其对应的变换曲线如下图所示。
和对数变换一样,伽马变换可以强调图像的某个部分。根据下面两个实验,可以看出伽马变换的作用。
实验1:
其实现Matlab代码为:
close all;
clear all;

%% -------------Gamma Transformations-----------------
f = imread('fractured_spine.tif');
f = mat2gray(f,[0 255]);

C = 1;
Gamma = 0.4;
g2 = C*(f.^Gamma);

figure();
subplot(1,2,1);
imshow(f,[0 1]);
xlabel('a).Original Image');

subplot(1,2,2);
imshow(g2,[0 1]);
xlabel('b).Gamma Transformations \gamma = 0.4');灰度拉伸
灰度拉伸也用于强调图像的某个部分,与伽马变换与对数变换不同的是,灰度拉升可以改善图像的动态范围。可以将原来低对比度的图像拉伸为高对比度图像。实现灰度拉升的方法很多,其中最简单的一种就是线性拉伸。而这里介绍的方法稍微复杂一些。灰度拉伸所用数学式如下所示。
同样的,其输入为 ,其输出也为
 。这个式子再熟悉不过了,跟巴特沃斯高通滤波器像极了,其输入输出关系也大致能猜到是个什么形状的。但是,这里就出现一个问题了,输入为0时候,式子无意义了。所以,在用Matlab计算的时候,将其变为如下形式。
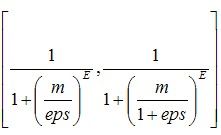
这里的eps,就是Matlab里面,一个很小数。如此做的话,式子变得有意义了。但是,其输入范围为 的时候,其输出范围变为了
 。输出范围大致为
 ,为了精确起见,使用mat2gray函数将其扩展到精确的
 。调用格式如下。
g = mat2gray(g,[1/(1+(m/eps)^E) 1/(1+(m/1+eps)^E)]);
m值的可取图像灰度分布的中央值,如下式所示,
决定m之后,接下来就只剩E了。灰度拉升的目的就是扩展图片的动态范围,我们想将原本灰度范围是 的图像变换到
 内。那么,就直接取最大值与最小值,带入式子,解出E就可以了。但是,如之前所说的,我们所用的式子的的输出范围达不到
 ,而且,直接取
 的范围,会造成E非常大,从而变换曲线的斜率非常大,灰度扩展的结果并不是很好。所以,这里退一步,取的输出范围是
 。E的取值,如下所示。
实验:
从直方图看,原图的灰度范围确实被拉伸了。用上面所说的方法,确定的灰度拉伸的输入输出曲线如下图所示。
其Matlab代码如下:
close all;
clear all;

%% -------------Contrast Stretching-----------------
f = imread('washed_out_pollen_image.tif');
%f = imread('einstein_orig.tif');
f = mat2gray(f,[0 255]);

[M,N] = size(f);
g = zeros(M,N);

Min_f = min(min(f));
Max_f = max(max(f));
m = (Min_f + Max_f)/2;

Out_put_min = 0.05;
Out_put_max = 0.95;

E_1 = log(1/Out_put_min - 1)/log(m/(Min_f+eps));
E_2 = log(1/Out_put_max - 1)/log(m/(Max_f+eps));
E = ceil(min(E_1,E_2)-1);

g = 1 ./(1 + (m ./ (f+ eps)).^E);
g = mat2gray(g,[1/(1+(m/eps)^E) 1/(1+(m/1+eps)^E)]);

figure();
subplot(2,2,1);
imshow(f,[0 1]);
xlabel('a).Original Image');

subplot(2,2,2);
r = imhist(f)/(M*N);
bar(0:1/255:1,r);
axis([0 1 0 max(r)]);
xlabel('b).The Histogram of a');
ylabel('Number of pixels');

subplot(2,2,3);
imshow(g,[0 1]);
xlabel('c).Results of Contrast stretching');

subplot(2,2,4);
s = imhist(g)/(M*N);
bar(0:1/255:1,s);
axis([0 1 0 max(s)]);
xlabel('b).The Histogram of a');
ylabel('Number of pixels');

in_put = 0:1/255:1;
Out_put1 = 1 ./(1 + (m ./ (double(in_put)+ eps)).^E);
Out_put1 = mat2gray(Out_put1,[1/(1+(m/eps)^E) 1/(1+(m/1+eps)^E)]);

figure();
plot(in_put,Out_put1);
axis([0,1,0,1]),grid;
axis square;
xlabel('Input intensity level');
ylabel('Onput intensity level');
灰度切割
灰度切割也是一个很简单,但也很实用的变换。灰度切割,主要用于强调图像的某一部份,将这个部分赋为一个较高的灰度值,其变换对应关系如下所示。
灰度切割有以上两种方法,一种是特定灰度值的部分赋值为一个较高的灰度值,其余部分为一个较低的灰度值。这样的方法,得到的结果是一个二值化图像。另外一种方法,则是仅仅强调部分赋值为一个较高的灰度值,其余的部分不变。
实验:
位图切割
位图切割,就是按照图像的位,将图像分层处理。若图像的某个像素,其bit7为1,则在位面7这个像素值为1,反之则为0。
实验:
由位图切割的结果,图像的主要信息包含在了高4位。仅仅靠高4位,还原的图像更原图基本差不多。由此可见,位图切割主要用于图像压缩。
博客地址:http://blog.csdn.net/thnh169/
![[数字图像处理]灰度变换——反转,对数变换,伽马变换,灰度拉伸,灰度切割,位图切割_第1张图片](http://img.e-com-net.com/image/info8/e608e95548c54fa483d6bb9e999f36af.jpg)
![[数字图像处理]灰度变换——反转,对数变换,伽马变换,灰度拉伸,灰度切割,位图切割_第2张图片](http://img.e-com-net.com/image/info8/c4d51959147b492c942963920ea9bc87.jpg)
![[数字图像处理]灰度变换——反转,对数变换,伽马变换,灰度拉伸,灰度切割,位图切割_第3张图片](http://img.e-com-net.com/image/info8/7d90fd64a3d54994a36af96dbc8046fa.jpg)
![[数字图像处理]灰度变换——反转,对数变换,伽马变换,灰度拉伸,灰度切割,位图切割_第4张图片](http://img.e-com-net.com/image/info8/e1dc367611be4a56b476b9878d6de5ad.jpg)
![[数字图像处理]灰度变换——反转,对数变换,伽马变换,灰度拉伸,灰度切割,位图切割_第5张图片](http://img.e-com-net.com/image/info8/87f841623fac4c63a2400ad7036c71f6.jpg)
![[数字图像处理]灰度变换——反转,对数变换,伽马变换,灰度拉伸,灰度切割,位图切割_第6张图片](http://img.e-com-net.com/image/info8/247d47f3644a4419add55bbc931cd7d1.jpg)
![[数字图像处理]灰度变换——反转,对数变换,伽马变换,灰度拉伸,灰度切割,位图切割_第7张图片](http://img.e-com-net.com/image/info8/ead059cf17bd41c7a389f7e67894a342.jpg)
![[数字图像处理]灰度变换——反转,对数变换,伽马变换,灰度拉伸,灰度切割,位图切割_第8张图片](http://img.e-com-net.com/image/info8/42432969eaf94437b6004c387c6f68de.jpg)