R 数据可视化 01 | 聚类热图
文章目录
- 示例数据
- 运行环境
- 绘制聚类热图
- 常规聚类热图绘制
- 无分类信息热图
- 无聚类热图
- 分割聚类树热图
- 多分组聚类热图
- 分组调色
- 显示文本
- 去除描边
- 字体相关
- 调整聚类树高
- 聚类方法选择
- 保存为图片
- 详细参数设置说明
- 设置工作目录
- 载入数据
- 获取数据子集
- 样本分类数据
示例数据
下载:链接:https://pan.baidu.com/s/1_b8swSkWDqIHZi6UwKaspA
提取码:pll7
文件说明
示例数据,其中数据均为虚拟数据,与实际生物学过程无关
文件名:dataset_heatmap.txt
列分别为基因,cell1的5个重复样本,cell2的5个重复样本
行代表每个基因在所有样本的FPKM值
运行环境
Rstudio:
如果系统中没有 Rstudio,先下载安装:https://www.rstudio.com/products/rstudio/download/#download
heatmaps 包:
如果没有安装该R包,执行以下代码:
if (!requireNamespace("BiocManager", quietly = TRUE))
    install.packages("BiocManager")

BiocManager::install("heatmaps")
绘制聚类热图
常规聚类热图绘制
# 执行前设置====================================
# 清空暂存数据
rm(list=ls())
# 载入R包
library(pheatmap)
# 设置工作目录
setwd("E:/R/WorkSpace/baimoc/visualization")

# 整理数据集====================================
# 载入数据
dataset <- read.table('resource/dataset_heatmap.txt',header = TRUE, row.names = 1)
# 截取表达矩阵的一部分数据来绘制热图
exp_ds = dataset[c(1:60),c(1:10)]
# 构建样本分类数据
cell_list=c(rep('cell_1',5),
            rep('cell_2',5))
annotation_c <- data.frame(cell_list)
rownames(annotation_c) <- colnames(exp_ds)

# 绘制热图=====================================
pheatmap(exp_ds, #表达数据
         cluster_rows = T,#行聚类
         cluster_cols = T,#列聚类
         annotation_col =annotation_c, #样本分类数据
         annotation_legend=TRUE, # 显示样本分类
         show_rownames = T,# 显示行名
         show_colnames = T,# 显示列名
         scale = "row", #对行标准化
         color =colorRampPalette(c("#8854d0", "#ffffff","#fa8231"))(100) # 热图基准颜色
)
无分类信息热图
# 将绘制热图部分替换为下列代码
# 绘制热图=====================================
pheatmap(exp_ds,
         show_rownames = T,
         show_colnames = T,
         scale = "row",
         color =colorRampPalette(c("#8854d0", "#ffffff","#fa8231"))(100)
)
无聚类热图
# 将绘制热图部分替换为下列代码
pheatmap(exp_ds, #表达数据
         cluster_rows = F,
         cluster_cols = F,
         show_rownames = T,
         show_colnames = T,
         scale = "row",
         color =colorRampPalette(c("#8854d0", "#ffffff","#fa8231"))(100)
)
分割聚类树热图
# 绘制热图=====================================
pheatmap(exp_ds,
         show_rownames = T,
         show_colnames = T,
         scale = "row",
         color =colorRampPalette(c("#8854d0", "#ffffff","#fa8231"))(100),
         cutree_cols = 2,
         cutree_rows = 20
)
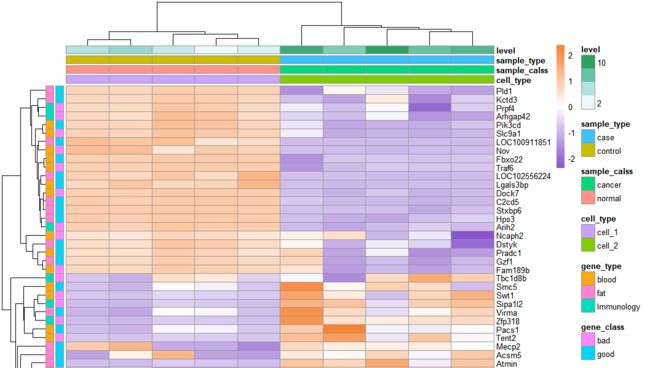
多分组聚类热图
# 清空暂存数据
rm(list=ls())
# 载入R包
library(pheatmap)
# 设置工作目录
setwd("E:/R/WorkSpace/baimoc/visualization")

# 整理数据集====================================
# 参数'./resource/dataset.txt',表示载入E:/R/WorkSpace/baimoc/visualization/resource/dataset_heatmap.txt
dataset <- read.table('resource/dataset_heatmap.txt',header = TRUE, row.names = 1)
# 截取表达矩阵的一部分数据来绘制热图
exp_ds = dataset[c(1:60),c(1:10)]
# 构建样本分类数据
cell_type=c(rep('cell_1',5),
            rep('cell_2',5))
sample_calss=c(rep('normal',5),
               rep('cancer',5))
sample_type=c(rep('control',5),
               rep('case',5))
level = c(1:10)

annotation_c <- data.frame(cell_type, sample_calss, sample_type, level)
rownames(annotation_c) <- colnames(exp_ds)

gene_class=c(rep('good',30),
             rep('bad',30))
gene_type=c(rep('fat',20),
            rep('blood',20),
            rep('Immunology',20))
annotation_r <- data.frame(gene_class, gene_type)
rownames(annotation_r) <- rownames(exp_ds)
# 绘制热图=====================================
pheatmap(exp_ds, #表达数据
         cluster_rows = T,#行聚类
         cluster_cols = T,#列聚类
         annotation_col =annotation_c, #样本分类数据
         annotation_row = annotation_r,
         annotation_legend=TRUE, # 显示样本分类
         show_rownames = T,# 显示行名
         show_colnames = T,# 显示列名
         scale = "row", #对行标准化
         color =colorRampPalette(c("#8854d0", "#ffffff","#fa8231"))(100), # 热图基准颜色
)
分组调色
# 清空暂存数据
rm(list=ls())
# 载入R包
library(pheatmap)
# 设置工作目录
setwd("E:/R/WorkSpace/baimoc/visualization")

# 整理数据集====================================
# 参数'./resource/dataset.txt',表示载入E:/R/WorkSpace/baimoc/visualization/resource/dataset_heatmap.txt
dataset <- read.table('resource/dataset_heatmap.txt',header = TRUE, row.names = 1)
# 截取表达矩阵的一部分数据来绘制热图
exp_ds = dataset[c(1:60),c(1:10)]
# 构建样本分类数据
sample_calss=c(rep('Normal',5),
               rep('Cancer',5))

annotation_c <- data.frame(sample_calss)
rownames(annotation_c) <- colnames(exp_ds)

gene_type=c(rep('Fat',20),
            rep('Blood',20),
            rep('Immunology',20))
annotation_r <- data.frame(gene_type)
rownames(annotation_r) <- rownames(exp_ds)

annotation_colors = list(sample_calss=c(Normal='#F8EFBA', Cancer='#FD7272'),
                         gene_type=c(Fat='#f1f2f6', Blood='#ced6e0', Immunology='#57606f'))
# 绘制热图=====================================
pheatmap(exp_ds, #表达数据
         cluster_rows = T,#行聚类
         cluster_cols = T,#列聚类
         annotation_col =annotation_c, #样本分类数据
         annotation_row = annotation_r,
         annotation_colors = annotation_colors,
         annotation_legend=TRUE, # 显示样本分类
         show_rownames = T,# 显示行名
         show_colnames = T,# 显示列名
         scale = "row", #对行标准化
         color =colorRampPalette(c("#8854d0", "#ffffff","#fa8231"))(100), # 热图基准颜色
)
显示文本
# 绘制热图=====================================
pheatmap(exp_ds,
         show_rownames = T,
         show_colnames = T,
         scale = "row",
         color =colorRampPalette(c("#8854d0", "#ffffff","#fa8231"))(100),
         display_numbers = T, # 显示数值
         fontsize_number = 8, # 设置字体大小
         number_color = '#4a4a4a', #设置颜色
         number_format = '%.2f' # 设置显示格式
)
去除描边
pheatmap(exp_ds, #表达数据
         show_rownames = T,# 显示行名
         show_colnames = T,# 显示列名
         scale = "row", #对行标准化
         color =colorRampPalette(c("#8854d0", "#ffffff","#fa8231"))(100), # 热图基准颜色
         border_color = 'NA',
)
字体相关
pheatmap(exp_ds, #表达数据
         show_rownames = T,# 显示行名
         show_colnames = T,# 显示列名
         scale = "row", #对行标准化
         color =colorRampPalette(c("#8854d0", "#ffffff","#fa8231"))(100), # 热图基准颜色
         fontsize = 10, # 全局字体大小,会被后边设置所覆盖
         fontsize_row = 8, # 行字体大小
         fontsize_col = 12, # 列字体大小
         angle_col = 45, # 设置列偏转角度,可选 270, 0, 45, 90, 315,
         gaps_row = T
)
调整聚类树高
pheatmap(exp_ds,
         show_rownames = T,
         show_colnames = T,
         scale = "row",
         color =colorRampPalette(c("#8854d0", "#ffffff","#fa8231"))(100),
         treeheight_row = 50,
         treeheight_col = 30
)
聚类方法选择
pheatmap(exp_ds,
         show_rownames = T,
         show_colnames = T,
         scale = "row",
         color =colorRampPalette(c("#8854d0", "#ffffff","#fa8231"))(100),
         clustering_distance_rows = 'euclidean', # 计算聚类间距的算法,可选'correlation', 'euclidean', 'maximum', 'manhattan', 'canberra', 'binary', 'minkowski'
         clustering_method = 'complete', # 聚类方法, 可选'ward', 'ward.D', 'ward.D2', 'single', 'complete', 'average', 'mcquitty', 'median' or 'centroid'
)
保存为图片
详细参数设置说明
设置工作目录
setwd("E:/R/WorkSpace/baimoc/visualization")
在R的执行过程中,为了方便,需要指定一个获取文件和输出文件所在的目录,这样就不需要每次设置全路径,只需要指定相对目录
setwd("E:/R/WorkSpace/baimoc/visualization")的意思就是设置工作目录为E:/R/WorkSpace/baimoc/visualization
载入数据
dataset <- read.table('resource/dataset_heatmap.txt',header = TRUE, row.names = 1)
因为工作目录已经设置,如果要获取E:/R/WorkSpace/baimoc/visualization/resource/dataset_heatmap.txt文件,那么就只需要设置相对路径resource/dataset_heatmap.txt
对于header = TRUE, row.names = 1代表读取文件表头,设置第一列为行名
获取数据子集
# 截取表达矩阵的一部分数据来绘制热图
exp_ds = dataset[c(1:60),c(1:10)]
原始数据:
如果获取前5个基因和cell1与cell2的前3个样本,只需要执行
exp_ds = dataset[c(1:5),c(1:3,6:8)]
样本分类数据
# 构建样本分类数据
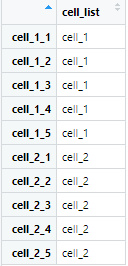
cell_list=c(rep('cell_1',5),
            rep('cell_2',5))
annotation_c <- data.frame(cell_list)
rownames(annotation_c) <- colnames(exp_ds)
这段代码目的是构建分类名与原始数据的列名的对应关系


