Python使用Plotly绘图工具,绘制气泡图
今天来讲讲如何使用Python 绘图工具,Plotly来绘制气泡图。
气泡图的实现方法类似散点图的实现。修改散点图中点的大小,就变成气泡图。
实现代码如下:
import plotly as py
import plotly.graph_objs as go

pyplt = py.offline.plot

trace0 = go.Scatter(
    x=[1, 2, 3, 4, 5, 6, 7],
    y=[8, 10, 12, 14, 16, 18, 20],
    mode='markers',
    marker=dict(
        size=[10, 14, 16, 18, 20, 42, 64], #设置气泡大小

    )
)

data = [trace0]
pyplt(data, filename='tmp/1.html')
会得到如下图所示的气泡图:

下面这个例子讲解如何设置气泡点的大小,颜色,还有提示文字,是否显示颜色条等信息
代码如下:
import plotly as py
import plotly.graph_objs as go

pyplt = py.offline.plot

trace0 = go.Scatter(
    x=[1, 2, 3, 4],
    y=[10, 11, 12, 13],
    mode='markers',
    text=['第1个气泡
size: 40
这里可以填写内容', '第2个气泡
size: 60', '第3个气泡
size: 80', '第4个气泡
size: 100'],
    marker=dict(
        color= [120, 125, 130, 135],
        opacity=[1, 0.8, 0.6, 0.4],
        size=[40, 60, 80, 100],
        showscale= True,
    )
)

data = [trace0]
pyplt(data, filename='tmp/1.html')
运行程序,得到如下图所示:
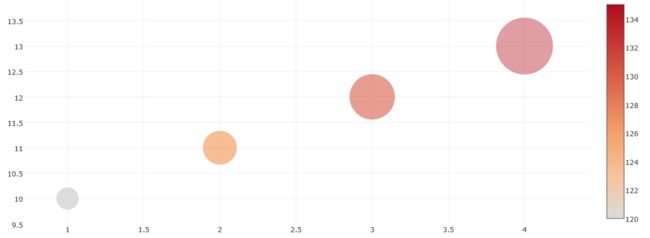
说明一下。
text可以指定每一个点,对应的悬浮窗文字信息(
表示换行)
color指定每个点的颜色,opacity指定点的透明度大小。
size 指定每个点的大小
showscale = True 表示显示右边的颜色条。
接下来讲解如何将气泡图进行缩放
调节大小通过设置参数sizeref进行设置的,当这个参数大于1时,将会减小气泡的大小。
当这个参数小于1时,将增大气泡的大小。
import plotly as py
import plotly.graph_objs as go
pyplt = py.offline.plot
trace0 = go.Scatter(
    x=[1, 2, 3, 4],
    y=[10, 11, 12, 13],
    text=['Asize: 40default', 'Bsize: 60default', 'Csize: 80default', 'Dsize: 100default'],
    mode='markers',
    name='default',
    marker=dict(
        size=[400, 600, 800, 1000],
        sizemode='area',
    )
)
trace1 = go.Scatter(
    x=[1, 2, 3, 4],
    y=[14, 15, 16, 17],
    text=['Asize: 40sizeref: 0.2', 'Bsize: 60sizeref: 0.2', 'Csize: 80sizeref: 0.2', 'Dsize: 100sizeref: 0.2'],
    mode='markers',
    name = 'ref0.2',
    marker=dict(
        size=[400, 600, 800, 1000],
        sizeref=0.2,
        sizemode='area',
    )
)
trace2 = go.Scatter(
    x=[1, 2, 3, 4],
    y=[20, 21, 22, 23],
    text=['Asize: 40sizeref: 2', 'Bsize: 60sizeref: 2', 'Csize: 80sizeref: 2', 'Dsize: 100sizeref: 2'],
    mode='markers',
    name='ref2',
    marker=dict(
        size=[400, 600, 800, 1000],
        sizeref=2,
        sizemode='area',
    )
)

data = [trace0, trace1, trace2]
pyplt(data, filename='tmp/1.html')
得到如下图所示:

参数sizeref=2 将气泡的大小设置为原来的1/2
参数sizemodes有两个值1.diameter和area这两个值。
1值按照直径缩放,2值按照表示面积进行缩放。