使用 Prometheus 和 Grafana 监控 Spring Boot 应用
使用 Prometheus 和 Grafana 监控 Spring Boot 应用
监控 Spring Boot 应用的状态,以及一些自定义的业务数据
监控 Spring Boot 应用
- 添加依赖 build.gradle
    compile('org.springframework.boot:spring-boot-starter-actuator')
    compile('io.micrometer:micrometer-core:1.5.1')
    compile('io.micrometer:micrometer-registry-prometheus:1.5.1')
- 修改配置 application.properties
需要注意的是,management.metrics.tags.application这个参数一定要有,否则很多报表会因为没有这个tag不能正常显示
# Actuator
management.endpoints.web.exposure.include=*
# Prometheus
management.metrics.tags.application=${spring.application.name}
- 添加 Prometheus 监控
- job_name: 'spring-prometheus'
  metrics_path: '/actuator/prometheus'
  scrape_interval: 5s
  static_configs:
    - targets:
      - host.docker.internal:8081
- 配置 Grafana
从 Grafana Dashboard 市场查找 Spring Boot 的看板,复制 ID 导入到 Grafana 中,如 6756
导入之后发现有些数据不能正确显示,这是因为设置了变量,需要修改变量的值:
Dashboard Setting -> Variables,选择相应的变量进行修改,这里修改两个:applicaiton 和 instance
application
label_values(application)
instance
label_values(jvm_memory_used_bytes{application="$application"},instance)
这样,就可以实现 application 和 instance的联动,选择application后,instance中显示相应的应用的实例
监控方法执行时间和数量
Prometheus 提供了时间和数量的监控指标,通过在定时任务上添加 @Counted和@Timed来监控数据;相关文档可以参考 The @Timed annotation
- 注入切面的Bean
@EnableAspectJAutoProxy
@Configuration
public class PrometheusAspectConfig {

    @Bean
    public TimedAspect timedAspect(MeterRegistry registry) {
        return new TimedAspect(registry);
    }

    @Bean
    public CountedAspect countedAspect(MeterRegistry registry) {
        return new CountedAspect(registry);
    }
}
监控定时任务
- 监控定时任务
@Slf4j
@Component
public class CustomScheduleTask {

    private static final Random random = new Random();

    @Scheduled(fixedDelay = 5000)
    @Timed(value = "custom_task_time", extraTags = {"name", "自定义定时任务"}, description = "自定义定时任务监控")
    public void customSchedule() throws InterruptedException {
        Thread.sleep(random.nextInt(5000));
        log.info("定时任务执行完成");
    }
}
- 查看监控数据
curl localhost:8081/actuator/prometheus | grep custom_task
监控接口
- controller
    @Timed
    @Counted
    @GetMapping("/timed")
    public Object timed() throws InterruptedException {
        return customService.timed(UUID.randomUUID().toString());
    }
- 监控数据
curl localhost:8081/actuator/prometheus | grep method_time
自定义监控指标
通过自定义监控指标监控业务相关数据
监控类型
相关监控类型的文档可以参考 Metrics types
相关使用文档可以参考 Prometheus JVM Client
- Counter
一个单调递增的累计计量,在重新启动时值会被置为0,可以用于统计请求数量,错误数量,任务完成的数量等;不能用Counter统计可以减少的值
- Gauge
Gauge 表示可以任意增减的值,通常用于计量类似温度,CPU使用率这样的值,或者正在处理的请求数量这样可增可减的值
- Histogram
统计直方图,通常用于统计请求的时间,响应body的大小等,并将其计数在可配置的存储桶中,它还提供所有观察值的总和
- Summary
和 Histogram 类似,它在滑动时间窗口内计算可配置的分位数,详细区别可以参考 Histograms and summaries
自定义监控请求统计
添加统计数据
定义统计请求数据,分别统计请求的次数,错误的次数,相应的时间;可以使用 Filter来实现
@Component
@Slf4j
public class AccessMetricsFilter implements Filter {

    @Autowired
    private CollectorRegistry collectorRegistry;

    @Value("${spring.application.name}")
    private String applicationName;

    private Counter totalCounter;
    private Counter errorCounter;
    private Histogram responseTime;

    @PostConstruct
    private void init() {
        log.info("初始化counter");

        totalCounter = Counter.build("custom_request_total", "自定义请求次数统计")
                              .labelNames("application", "path")
                              .create();

        errorCounter = Counter.build("custom_request_error", "自定义请求错误次数统计")
                              .labelNames("application", "path")
                              .create();

        responseTime = Histogram.build("custom_response_time", "自定义请求响应时间")
                                .labelNames("application", "path")
                                .create();

        collectorRegistry.register(totalCounter);
        collectorRegistry.register(errorCounter);
        collectorRegistry.register(responseTime);
    }

    @Override
    public void doFilter(ServletRequest servletRequest, ServletResponse servletResponse, FilterChain filterChain) throws IOException, ServletException {
        HttpServletRequest request = ((ServletRequestAttributes) RequestContextHolder.getRequestAttributes()).getRequest();
        String path = request.getRequestURI();

        Histogram.Timer timer = responseTime.labels(applicationName, path).startTimer();

        try {
            filterChain.doFilter(servletRequest, servletResponse);
        } catch (Exception e) {
            errorCounter.labels(applicationName, path).inc();
            throw e;
        } finally {
            totalCounter.labels(applicationName, path).inc();
            timer.observeDuration();
        }
    }
}
- 启动应用,访问接口后查看统计数据
curl localhost:8081/actuator/prometheus | grep custom_request

# HELP custom_request_total 自定义请求次数统计
# TYPE custom_request_total counter
custom_request_total{path="/order",} 3.0
custom_request_total{path="/db",} 1004.0
custom_request_total{path="/actuator/prometheus",} 150.0
# HELP custom_request_error 自定义请求错误次数统计
# TYPE custom_request_error counter
添加监控看板
- 现在要统计所有的错误请求次数,可以在 Prometheus的查询面板中查询:
这样,就可以得到相应的错误数据,接下来只需要在Grafana中展示就可以
- 添加看板
添加一个 Dashboard,并添加一个 Panel,在 Panel 的 Metrics 中添加刚才的查询语句
执行查询后,会看到有图表生成,变量的名称通过 Legend 字段指定,如这里是 custom_request_total{application="prometheus", instance="host.docker.internal:8081", job="spring-prometheus", path="/db"},需要显示路径名称,即 path 的值,可以设置 Legend 为 {{path}},这样会显示正确的名称
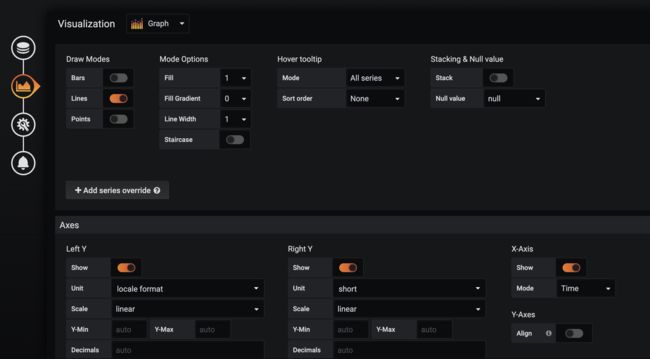
其他的显示单位,显示效果等以及面板的名称可以通过旁边的设置选项进行配置
- 添加应用和实例变量
Dashboard Settings -> Variables
label_values(application)

label_values(jvm_memory_used_bytes{application="$application"},instance)
- 添加统计数据查询
# 请求总次数
sum(custom_request_total{application="$application",instance="$instance"})

# 错误请求总次数
sum(custom_request_total{application="$application", instance="$instance"})

# 每分钟请求次数
rate(custom_request_total{application="$application", instance="$instance"}[1m])

# 每分钟错误请求次数
rate(custom_request_error{application="$application", instance="$instance"}[$__interval])
- 相关项目可以参考 Prometheus


