用R语言绘制动态地图,代码奉上!(REmap包详解)
options(remap.ak="MY07CLhm3wKi4N2tQ6WP4kzz21BBZagI")
安装包
library(devtools)
install_github('badbye/baidumap')
install_github('lchiffon/REmap')
baidumap包函数说明
getBaiduMap函数
| getBaiduMap(location, width = 400, height = 400, zoom = 10, scale = 2, color = "color", messaging = TRUE) 参数: location:包含经度和维度的向量或者是一个矩阵,或者可以是一个字符串表示地址;经纬度和地址将作为地图的中心点 width,height:map的宽和高 zoom:map的缩放比例,是一个整数,从3(洲)到21(building),默认值是10 scale:像素数 color:"color" or "bw",表示有色或者是黑白 messaging:逻辑语句,决定是否输出下载数据的信息 |
案例:
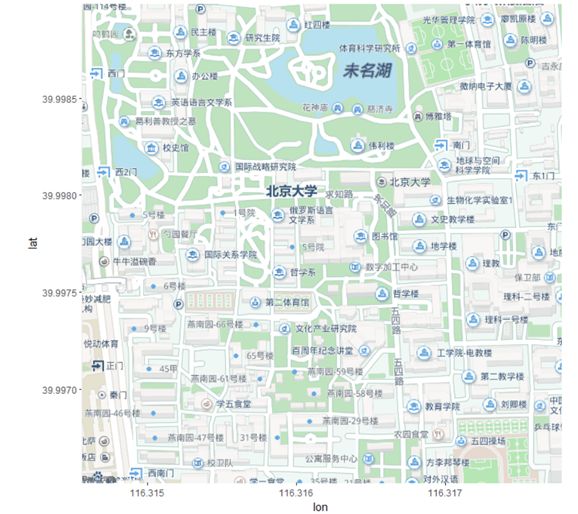
| library(baidumap) library(ggmap) #获取北京大学的地图信息 q <- getBaiduMap('北京大学', width=600, height=600, zoom=18, scale = 2, messaging=FALSE) ggmap(q) #绘制地图 |
getCoordinate函数
| 根据地址得到经纬度 # 参考文档 getCoordinate(address, city = NULL, output = "json", formatted = F) 参数: address:地址 city:可选项,地质所在的城市 output:json或者xml格式 formatted:F返回原有的json或者xml格式,而T返回的是经纬度的矩阵 |
案例
| getCoordinate('北京大学',output='xml') #xml格式 getCoordinate('北京大学',output='json') #json格式 getCoordinate('北京大学',output='xml',formatted = T) #矩阵形式 #可以同时多个地点 getCoordinate(c('北京大学', '清华大学', '人民大学'), formatted = T) |
getLocation
| 通过经纬度得到地址 # 参考文档 getLocation(location, output = "json", formatted = F, pois = 0) 参数: location:经纬度 output:json或者xml格式 formatted:是否返回一个较好的结果 pois:是否返回这个位置周围的PIO |
案例
| getLocation(c(118.12845, 24.57232),formatted = T) #同样可以返回多个位置 getLocation(c(118.12845, 24.57232,116.31234,40.56125),formatted = T)
#fromJSON函数的用法 library(rjson) js <- getLocation(c(116.31617,39.99775),output='json') #json格式 fromJSON(js) #返回一个列表,包含了该地址下的
## 对于含多个经纬度的矩阵 loc = matrix(c(117.93780, 24.55730, 117.93291, 24.57745, 117.23530, 24.64210, 117.05890, 24.74860), byrow=T, ncol=2)
### 得到json格式 location_json = getLocation(loc, output='json')
### 设计一个函数返回district,即所属的区
getDistrict = function(x_json){ x_list = fromJSON(x_json) #json转化为list x_list$result$addressComponent$district #返回所属的区 }
location_district = sapply(location_json, getDistrict) #运用上面的函数到这个json对象上 location_district |
getPlace函数
| 返回地图搜索结果 getPlace(place = NULL, city = "北京")
参数: place:你想要搜索的地方 city:城市
返回值:数据框dataframe:包含名字、经纬度、地址等 |
案例
| #查找北京的大学 bj_college = getPlace('大学','北京') ## Mcdonald's in shanghai sh_mcdonald = getPlace('麦当劳', '上海') |
getRoute函数
| 通过搜索得到路线 getRoute(...) 参数: origin:起点 destination:终点 mode:出行方式,'walk','transit' region:起点和终点所在区域,若不在同一地区,分别用origin_region和destination_region tactics:10(不走高速), 11(默认, 最短时间), 12(最短路径). coord_type:'bd09ll'(default), 'gcj02'(which Google map and Soso map are using), 'wgs84' for GPS devices. 返回值:dataframe:包含经纬度 |
案例
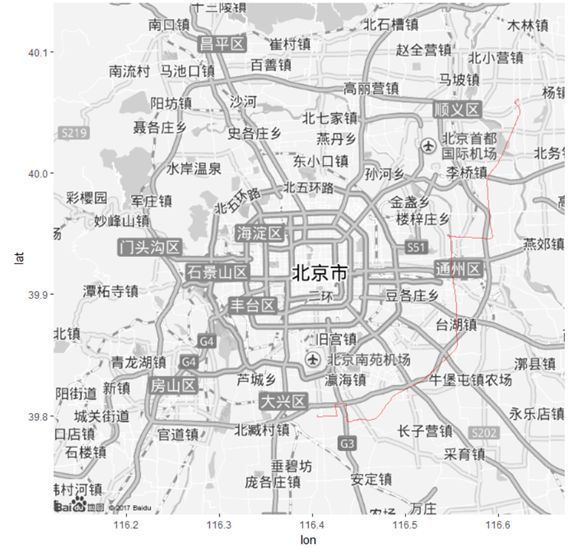
| bjMap = getBaiduMap('北京',color = 'bw') df = getRoute('首都国际机场', '北京南苑机场') ggmap(bjMap) + geom_path(data = df, aes(lon, lat), alpha = 0.5, col = 'red') |
REmap函数
绘制地图使用的是主函数remap
| remap(mapdata, title = "", subtitle = "", theme =get_theme("Dark")) mapdata一个数据框对象,第一列为出发地点,第二列为到达地点 title标题 subtitle副标题 theme控制生成地图的颜色,具体将会在get_theme部分说明 |
制作迁徙地图
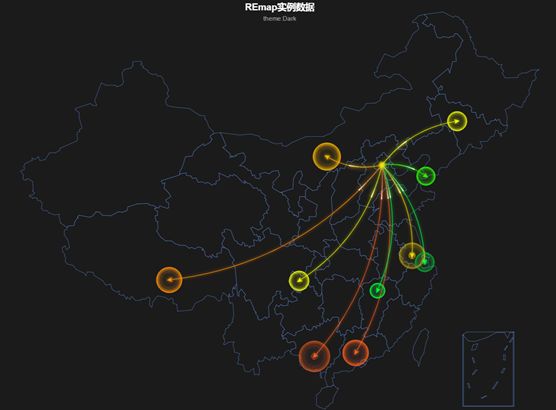
| origin = rep("北京",10) destination = c('上海','广州','大连','南宁','南昌', '拉萨','长春','包头','重庆','常州') dat = data.frame(origin,destination) out = remap(dat,title = "REmap实例数据",subtitle = "theme:Dark") plot(out) |
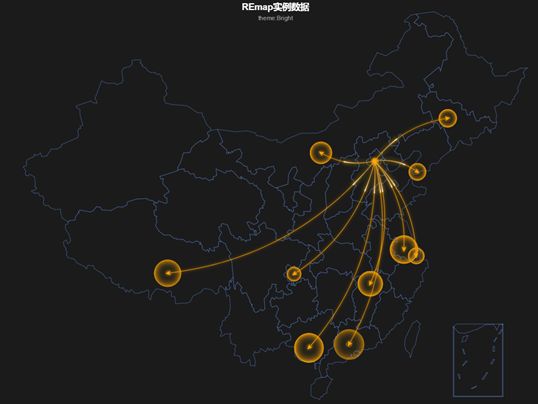
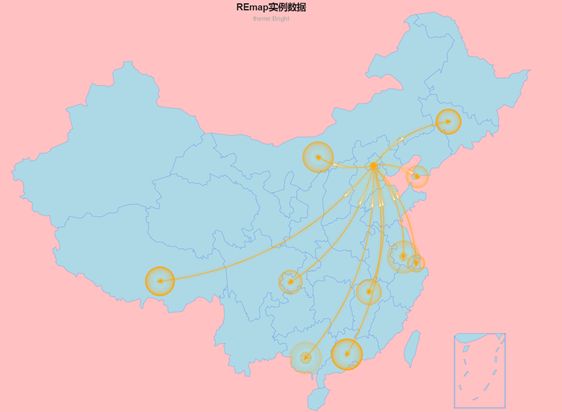
| out = remap(dat,title = "REmap实例数据",subtitle = "theme:Bright", theme = get_theme("None", lineColor = "orange")) plot(out) |
| ## Set Region Color out = remap(dat,title = "REmap实例数据",subtitle = "theme:Bright", theme = get_theme("None", lineColor = "orange", backgroundColor = "#FFC1C1", titleColor = "#1b1b1b", regionColor = '#ADD8E6')) plot(out) |
REmapH函数
这个函数的特色是可以做中心辐射的热力图,这种热力图在气象、人口密度、海拔测绘领域有诸多运用,当然也可以上当用在商务场合——特别是跟地理信息有关的数据呈现方面。
remapH(data,
maptype = 'china',
theme = get_theme("Dark"),
blurSize = 30,
color = c('blue', 'cyan', 'lime', 'yellow', 'red'),
minAlpha = 0.05,
opacity = 1,
...)
data为要传入的数据,数据为三列,第一列为lon(经度),第二列为lat(维度),第三列为prob(密度/概率);
maptype为要绘制的地图类型,可选有:"china","world"或中国各省份名字;
theme为绘制的地图主题类型,可由get_theme函数传入;
blurSize为热力效果的泛化范围,可调整热力点中心的扩散程度;
color为热力的渐变颜色;
minAlpha为热力点的展示阈值,对应data中的prob列,作图时各点密度会对比minAlpha,以凸显不同密度所展示的不同热力分布;
opacity为透明度,调整热力图的透明度。
get_theme(theme = "Dark",
lineColor = "Random",
backgroundColor = "#1b1b1b",
titleColor = "#fff",
borderColor = "rgba(100,149,237,1)",
regionColor = "#1b1b1b",
labelShow = T,
pointShow = F,
pointColor = "gold"
)
theme为主题,设置该参数后无需设置get_theme里其他参数,可选有"Dark"、"Sky"、"blue"和"none"四种
lineColoe为线条颜色,对应为map图里面迁徙线条的颜色
backgroundColor为图片的背景色,支持16进制颜色输入,也支持rgb()函数和rgba()
titleColor为标题的颜色,设置同上
borderColor为地图中各省、市边界颜色
regionColor为地图中各区域颜色,各省份和市
labelShow为是否展示各省、市名字,设置为True时展示
pointShow为是否展示各省会城市所在点,设置为True时展示
pointColor设置上述点的颜色
制作热力图
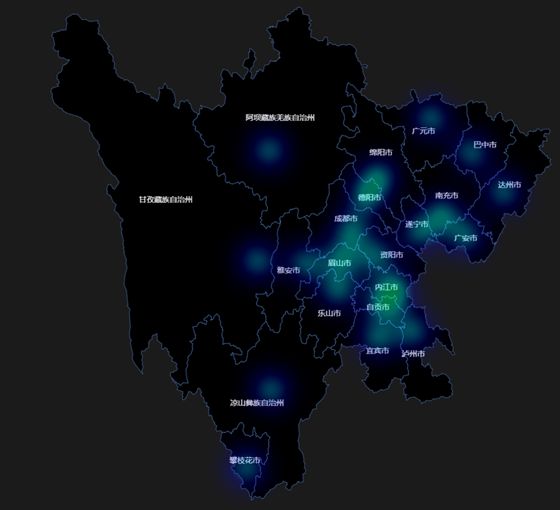
| library(baidumap) library(REmap) options(remap.js.web=T) city_ln<-mapNames("sichuan") city_list<-get_geo_position(city_ln) #生成一列密度数据 point<-round(runif(length(city_ln),min=0.3,max=0.95),2) #合成数据框格式的热力图作图数据: newdata<-data.frame(city_list[,1:2],point) map_out1<-remapH(newdata, maptype = "四川", theme =get_theme(theme = "Dark"), blurSize = 70, color = "red", minAlpha = 10, opacity = 1, ) plot(map_out1) |
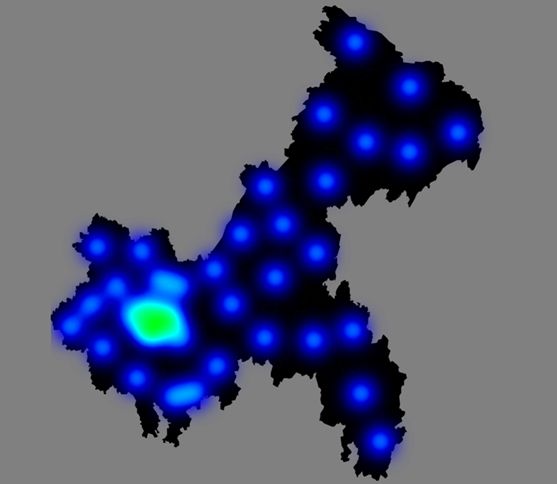
| cq <- mapNames('chongqing');cq baidu_lon <- c() baidu_lat <- c() ak <- 'MY07CLhm3wKi4N2tQ6WP4kzz21BBZagI' #百度地图api的秘钥,需自己申请 library(RCurl) library(rjson) for (location in cq) { url <- paste('http://api.map.baidu.com/geocoder/v2/?ak=',ak,'&callback=renderOption&output=json&address=',location,sep="") url_string <- URLencode(url) json<- readLines(url_string, warn=F) geo <- fromJSON(substr(json,regexpr('\\(',json)+1,nchar(json)-1)) lon<-geo$result$location$lng lat<-geo$result$location$lat baidu_lon <- c(baidu_lon,lon) baidu_lat <- c(baidu_lat,lat) } data <- data.frame(address=cq,longitude=baidu_lon,latitude=baidu_lat) head(data) prob <- sample(1:100,nrow(data)) prob <- prob/(min(prob)+max(prob)) f_data <- cbind(data[-1],prob) head(f_data) #生成最终热力图 remapH(data = f_data, maptype = '重庆', theme = get_theme(theme = 'none', backgroundColor = 'gray', #整体背景颜色 borderColor = 'black', #区域边缘颜色 labelShow = F, #区域名称是否显示 regionColor = 'gray', #区域颜色 pointShow = F), blurSize = 50, #越大范围越大,越虚化 minAlpha = 0.5, opacity = 4 #不透明度越大越明显 ) |
解读: 有几点发现,一是点多才能有热力效果,记录条数太少显示效果较差。二是初始输入数据的第三列密度值大小对结果展现无影响(使用此函数的初始目的是根据不同点的密度不一样,反映不同的热力密度,但是实际变化数值后展示的结果图没有变化)。三是除了密度数据大小变化无影响外,get_theme( )函数里的参数regionColor设置也失效。此函数的热力图的展示与参数设置关系紧密,blurSize和opacity改变对结果展示影响特别大,需自行调整适应。
REmapB函数
remapB(center = c(104.114****29,37.550339),
zoom = 5,
color = "Bright",
title = "",
subtitle = "",
markLineData = NA,
markPointData = NA,
markLineTheme = markLineControl(),
markPointTheme = markPointControl(),
geoData = NA)
参数说明:
参数一:center为地图中心,经纬度格式;
参数二:zoom为缩放设置,默认为5,代表全国地图,增大至10可放大至地市
参数三:color为地图颜色,可选有"Bright", "Blue", "light", "dark", "redalert", "googlelite", "grassgreen", "midnight", "pink", "darkgreen", "bluish", "grayscale", "hardedge"
参数四:title为地图主标题
参数五:subtitle为地图副标题
参数六:markLineData为绘制线条需要的数据,包括起点和终点两列
参数七:markPointDate为绘制点需要的数据,仅终点一列
参数八:markLineTheme为线条主题设置,通过markLineControl( )函数设置
参数九:markPointTheme为点主题设置,通过markPointControl( )函数设置
参数十:geoData为点、线绘制的地理位置数据存储,可以只是输入经纬度数据,也可通过get_geo_position('地点')获取
其中以上参数中,markLineTheme和markPointTheme 内含有诸多属性设置,类似REmap中的theme设置:
markLineTheme = markLineControl(symbol = NA,#控制线型
symbolSize = c(0,4), #线条粗度变动范围
smooth = T, #启用线条平滑度设置
smoothness =0.2, #线条平滑度
effect = T, #线条动效
lineWidth = 2, #线宽
lineType = 'dotted', #线条类别
color ='Random') #线条颜色
参数说明:
参数一:symbol为标记样式,具体指线条两端的标记的形状,两个值分别为起点和终点,经过实际使用symbol参数不可修改
参数二:symbolSize为线条两端标记大小,对应symbol参数的两个值,实际上第一个值没用,因为开始标记为none
参数三:smooth为逻辑参数,设置线条是否平滑
参数四:smoothness为平滑度,smooth参数设置为T时有效,体现线条的弧度,减小到0时为直线
参数五:effect为逻辑参数,是否显示动态效果
参数六:lineWidth为线条粗细
参数七:lineType为线条类型,可选有solid(实线)、dotted(点线)、dashed(虚线)
参数八:color为线条颜色
根据以上参数名称,可以大致了解每一个参数的含义:
markPointTheme = markPointControl(symbol = "heart", #点形状
symbolSize = "Random", #点大小
effect = T, #动效启用
effectType = "scale", #动效类型
color = "Random") #颜色
参数说明:
参数一:symbol为点样式,可选项none、circle、rectangle、triangle、diamond、emptyCirle、emptyRectangle、emptyTriangle、emptyDiamond、heart、droplet、pin、arrow、star
参数二:symbolSize为点大小
参数三:effect为逻辑参数,是否显示动态效果
参数四:effectType为动态效果样式,可选scale(放大)和bounce(跳动)
参数五:color为点颜色
解读:effect参数在点太多时,动态效果会失效,这时建议设置为FALSE。在remapB( )函数中通过另外一个参数markPointData也可以设置点颜色,优先级高于color参数。
制作流向图
案例
| destination<- c("shanghai","guangzhou","济南","dalian","xian","chengdu","changchun","taiyuan","nanyang","zhengzhou") #终点 origin <- rep("nanyang",length(destination)) map_data<- data.frame(origin,destination) #合成数据框格式的作图数据 map_out<-remapB(zoom=5, #参数5绘制省级国家地图 color="dark", title="我是主标题", subtitle="我是副标题", markLineData=map_data, markPointData=destination, markLineTheme=markLineControl(), markPointTheme=markPointControl() ) plot(map_out) |
通过设置markLineTheme、markPointTheme两个主题内部的详细风格参数,你可以对线条以及数据点的气泡进行个性化设置。
| map_out1<-remapB(zoom=5, color="dark", title="我是主标题", subtitle="我是副标题", markLineData=map_data, markPointData=destination, markLineTheme = markLineControl( symbol = NA, symbolSize = c(0,4), smooth = T, smoothness =0.2, effect = T, lineWidth = 2, lineType ="dotted", color ="white"), markPointTheme = markPointControl( symbol = "heart", symbolSize = "Random", effect = T, effectType = "scale", color = "white") ) plot(map_out1) |
如果只想要绘制流向线而不需要终点的点的话,直接给markPointData赋值为NA就可以了。只要将我们的数据结构重新整理,就可以制作出路径地图:
| newdata<- c("shanghai","guangzhou","chengdu","xian","taiyuan","济南","shanghai") origin<-c(newdata[-7]) destination<-c(newdata[-1]) map_data<- data.frame(origin,destination) map_out2<-remapB(zoom=5, color="dark", title="我是主标题", subtitle="我是副标题", markLineData=map_data, markPointData=destination, markLineTheme = markLineControl( symbol = NA, symbolSize = c(0,4), smooth = T, smoothness =0.2, effect = T, lineWidth = 2, lineType ="dotted", color ="white"), markPointTheme = markPointControl( symbol = "heart", symbolSize = "Random", effect = T, effectType = "scale", color = "white") ) plot(map_out2) |
制作目标分布图
| library(baidumap) #查找大连的所有大学 dl_college <- getPlace("大学","大连") #构造作图数据: newdata1<-dl_college[,c(4,3,1)] map_out3 <- remapB(center = c(121.62139,38.91934), zoom = 14, color = "Blue", title = "大连高校分布图", markPointData =newdata1[3], markPointTheme = markPointControl( symbol = "pin", symbolSize = 8, effect = T, color = "yellow"), geoData =newdata1 ) plot(map_out3) |
制作方位图
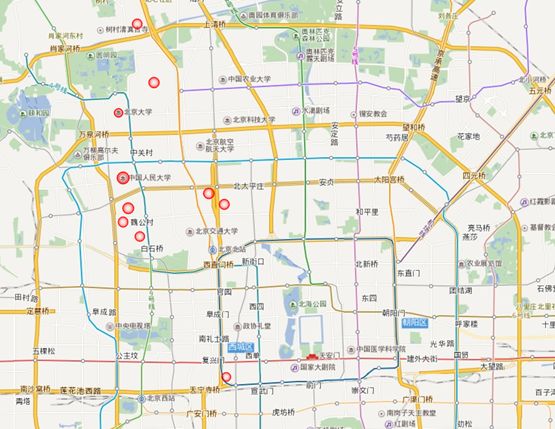
| #北京大学名单 University <- c("北京大学","清华大学","中国人民大学","北京外国语大学","北京理工大学", "北京邮电大学","中央音乐学院","中央民族大学","北京体育大学","中国政法大学") #获取经纬度 Uni_Geo <- get_geo_position(University) #绘制方位图 Uni_resutl <- remapB(markPointData = data.frame(Uni_Geo$city), markPointTheme = markPointControl(symbol = "circle", effect = TRUE,#动态效果 symbolSize = 8, color = "red"), geoData = Uni_Geo
)
#其中,color参数一项还有以下选择:"Bright", "Blue", "light", "dark", "redalert", "googlelite", "grassgreen", "midnight", "pink", "darkgreen", "bluish", "grayscale", "hardedge" |
制作上海地铁线
Line8
| 121.538591 |
31.32849 |
市光路 |
| 121.538555 |
31.32096 |
嫩江路 |
| 121.538447 |
31.31103 |
翔殷路 |
| 121.539633 |
31.30189 |
黄兴公园 |
| 121.541322 |
31.2948 |
延吉中路 |
| 121.534459 |
31.28465 |
黄兴路 |
| 121.524829 |
31.28088 |
江浦路 |
| 121.516026 |
31.279 |
鞍山新村 |
| 121.507833 |
31.28057 |
四平路 |
| 121.497053 |
31.28211 |
曲阳路 |
| 121.485914 |
31.27579 |
虹口足球场 |
| 121.475386 |
31.26946 |
西藏北路 |
| 121.47535 |
31.25906 |
中兴路 |
| 121.478117 |
31.24838 |
曲阜路 |
| 121.482285 |
31.23878 |
人民广场 |
| 121.485842 |
31.23319 |
大世界 |
| 121.489472 |
31.22473 |
老西门 |
| 121.492777 |
31.21756 |
陆家浜路 |
| 121.496155 |
31.20771 |
西藏南路 |
| 121.500898 |
31.1914 |
中华艺术宫 |
| 121.501114 |
31.18408 |
耀华路 |
| 121.502767 |
31.17651 |
成山路 |
| 121.500323 |
31.16675 |
杨思 |
| 121.487028 |
31.15939 |
东方体育中心 |
| 121.496335 |
31.14669 |
凌兆新村 |
| 121.504383 |
31.12499 |
芦恒路 |
| 121.512899 |
31.10214 |
浦江镇 |
| 121.515163 |
31.08996 |
江月路 |
| 121.515199 |
31.09005 |
联航路 |
| 121.518864 |
31.0671 |
沈杜公路 |
Line12
| 121.645211 |
31.268982 |
金海路 |
| 121.633874 |
31.285879 |
申江路 |
| 121.622178 |
31.285478 |
金京路 |
| 121.596181 |
31.286203 |
巨峰路 |
| 121.585186 |
31.288749 |
东陆路 |
| 121.567867 |
31.28716 |
复兴岛 |
| 121.559441 |
31.286342 |
爱国路 |
| 121.550925 |
31.281528 |
隆昌路 |
| 121.539139 |
31.274784 |
宁国路 |
| 121.530336 |
31.270463 |
江浦公园 |
| 121.519646 |
31.263765 |
大连路 |
| 121.513393 |
31.259151 |
提篮桥 |
| 121.50486 |
31.255878 |
国际客运中心 |
| 121.488888 |
31.249704 |
天潼路 |
| 121.478054 |
31.2483 |
曲阜路 |
| 121.464283 |
31.247389 |
汉中路 |
| 121.466313 |
31.235579 |
南京西路 |
| 121.465541 |
31.223058 |
陕西南路 |
| 121.46723 |
31.208991 |
嘉善路 |
| 121.470212 |
31.20042 |
大木桥路 |
| 121.463475 |
31.191338 |
龙华中路 |
| 121.459271 |
31.17929 |
龙华 |
| 121.450359 |
31.17688 |
龙漕路 |
| 121.441394 |
31.174841 |
漕宝路 |
| 121.425117 |
31.173064 |
桂林公园 |
| 121.409019 |
31.168105 |
虹梅路 |
| 121.398761 |
31.160952 |
东兰路 |
| 121.398958 |
31.14672 |
顾戴路 |
| 121.385987 |
31.14295 |
虹莘路 |
| 121.369835 |
31.137788 |
七莘路 |
| library(REmap)
#分别加载8号线、12号线数据 data8 <- read.table("clipboard",header=F) data12 <- read.table("clipboard",header=F) line8 = t(data8[3]) line12 = t(data12[3]) #获取地铁站数量 len8 <- length(line8) len12 <- length(line12)
#为合并数据做准备 origin8 = line8[1:len8-1] destination8 = line8[2:len8] origin12 = line12[1:len12-1] destination12 = line12[2:len12]
#合并数据 origin = c(origin8,origin12) destination = c(destination8,destination12)
#为remapB函数做数据准备 data_all = rbind(data8,data12) dat = data.frame(origin,destination) remapB(center = get_city_coord("上海"), zoom = 12, title = "Remap: 上海地铁", color = "Blue", markLineData = dat, markLineTheme = markLineControl(smoothness = 0, effect = T, symbolSize = c(0,0)), geoData = data_all) |
REmapC函数
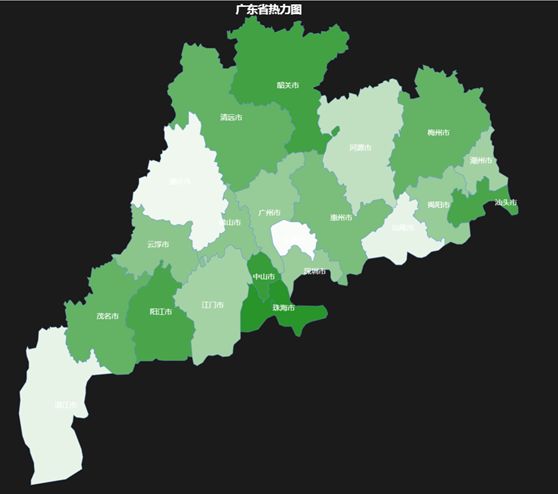
制作填充图
| #虚构一份数据:城市名单及对应值 city <- mapNames("guangdong") value <- runif(21,min = 1,max = 100)
#构建数据框 data_DF <- data.frame(city,value)
#绘制填充地图 result <- remapC(data_DF, title ="广东省热力图", maptype = "guangdong", color = "green", theme = get_theme("Dark"), maxdata = 100, mindata = 1) |
| province <- mapNames("china") #全国省份 value <- rnorm(34,100,30) #随机生成分省值 mydata <- data.frame(province,value) #合成数据框作图数据 remapC(mydata,color=c("yellow","red"),title="全国分省热地图",subtitle="我是副标题") |
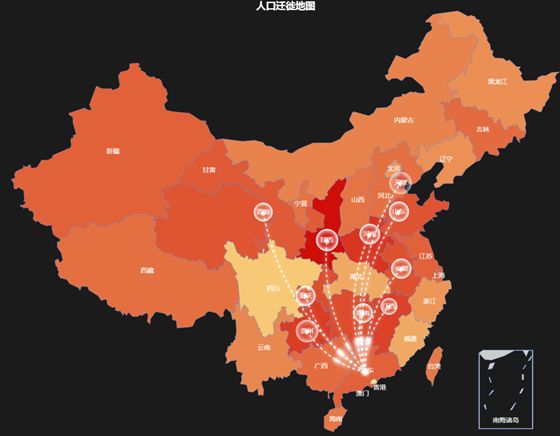
制作人口迁徙地图
| province <- mapNames("china") #全国省份 value <- round(rnorm(34,1000,30),0) #随机生成分省值 mydata <- data.frame(province,value) #合并数据 labelper<-mydata[order(mydata[,"value"],decreasing=T),][1:10,] origin<-rep("广州",length(labelper)) destination<-labelper$province line_data<-data.frame(origin,destination) map_out1 <- remapC(mydata, maptype = "china", title="人口迁徙地图", theme = get_theme("Drak"), color=c("#CD0000","#FFEC8B"), markLineData=line_data, markLineTheme=markLineControl( color="white", lineWidth=2, lineType="dashed" ), markPointData=line_data[2], markPointTheme=markPointControl( symbolSize=13, effect=T, effectType="scale", color="white" ) ) plot(map_out1) |
因为假设广东是人口迁出地,给广东填色是没有任何意义的,所以mydata数据中需要忽略 广东的数据
| mydata1 <- mydata[-12,] map_out2 <- remapC(mydata1, maptype = "china", title="人口迁徙地图", theme = get_theme("Drak"), color=c("#CD0000","#FFEC8B"), markLineData=line_data, markLineTheme=markLineControl( color="white", lineWidth=2, lineType="dashed" ), markPointData=line_data[2], markPointTheme=markPointControl( symbolSize=13, effect=T, effectType="scale", color="white" ) ) plot(map_out2) |

