matlab实现SVM算法进行分类
1.实验内容
(1)掌握支持向量机(SVM)的原理,核函数类型选择以及核参数选择原则等,并用malab的SVM函数求解各类分类问题实例。
(2)熟悉基于libsvm二分类的一般流程与方法,并对"bedroom,forest"两组数据进行分类(二分类),最后对试验分类的准确率进行分析。
2.实验过程
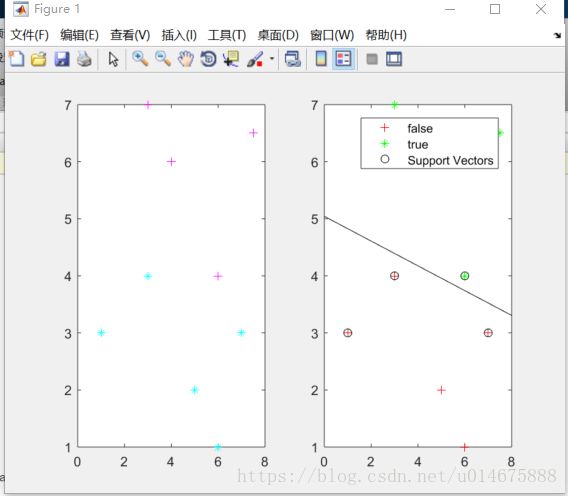
(1)线性分类
>> sp = [3,7;6,4;4,6;7.5,6.5]

sp =

    3.0000    7.0000
    6.0000    4.0000
    4.0000    6.0000
    7.5000    6.5000

>> nsp = size(sp)

nsp =

     4     2

>> sn = [1,3;5,2;7,3;3,4;6,1]

sn =

     1     3
     5     2
     7     3
     3     4
     6     1

>> nsn = size(sn)

nsn =

     5     2

>> sd = [sp;sn]

sd =

    3.0000    7.0000
    6.0000    4.0000
    4.0000    6.0000
    7.5000    6.5000
    1.0000    3.0000
    5.0000    2.0000
    7.0000    3.0000
    3.0000    4.0000
    6.0000    1.0000

>> lsd = [true true true true false false false false false]

lsd =

  1×9 logical 数组

   1   1   1   1   0   0   0   0   0

>> Y = nominal(lsd)

Y =

  1×9 nominal 数组

     true      true      true      true      false      false      false      false      false

>> figure(1);
>> subplot(1,2,1)
>> plot(sp(1:nsp,1),sp(1:nsp,2),'m+');
>> hold on
>> plot(sn(1:nsn,1),sn(1:nsn,2),'c*');
>> subplot(1,2,2)
>> svmStruct = svmtrain(sd,Y,'showplot',true);
警告: svmtrain will be removed in a future release. Use fitcsvm instead.
> In svmtrain (line 230)
>>
线性分类结果:
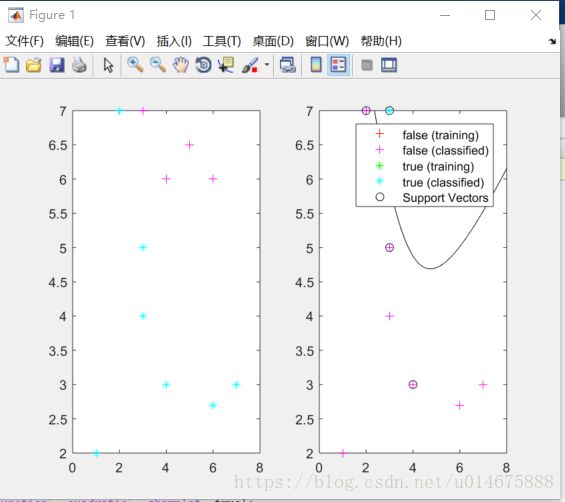
(2)非线性分类
  >> sp = [3,7;6,6;4,6;5,6.5]

sp =

    3.0000    7.0000
    6.0000    6.0000
    4.0000    6.0000
    5.0000    6.5000

>> nsp = size(sp);
>> sn = [1,2;3,5;7,3;3,4;6,2.7;4,3;2,7];
>> nsn = size(sn)

nsn =

     7     2

>> sd = [sp;sn]

sd =

    3.0000    7.0000
    6.0000    6.0000
    4.0000    6.0000
    5.0000    6.5000
    1.0000    2.0000
    3.0000    5.0000
    7.0000    3.0000
    3.0000    4.0000
    6.0000    2.7000
    4.0000    3.0000
    2.0000    7.0000

>> lsd = [true true true true false false false false false false false]

lsd =

  1×11 logical 数组

   1   1   1   1   0   0   0   0   0   0   0

>> Y = nominal(lsd)

Y =

  1×11 nominal 数组

     true      true      true      true      false      false      false      false      false      false      false

>> figure(1);
>> subplot(1,2,1)
>> plot(sp(1:nsp,1),sp(1:nsp,2),'m+');
>> hold on
>> plot(sn(1:nsn,1),sn(1:nsn,2),'c*');
>> subplot(1,2,2)
>> svmStruct = svmtrain(sd,Y,'kernel_Function','quadratic','showplot',true);
警告: svmtrain will be removed in a future release. Use fitcsvm instead.
> In svmtrain (line 230)
>> %use the trained svm (svmStruct) to classify the data
>> RD = svmclassify(svmStruct,sd,'showplot',true)
警告: svmclassify will be removed in a future release. Use the predict method of an object returned by fitcsvm instead.
> In svmclassify (line 47)

RD =

  11×1 nominal 数组

     true
     true
     true
     true
     false
     false
     false
     false
     false
     false
     false

>> % RD is the classification result vector
非线性分类结果
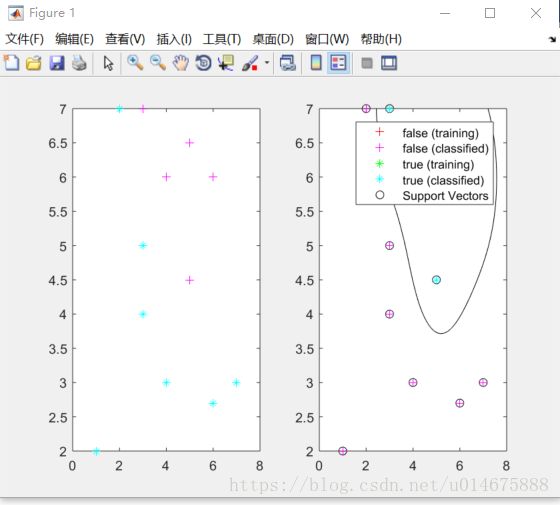
(3)高斯分类
 >> sp = [5,4.5;3,7;6,6;4,6;5,6.5]%positive sample points

sp =

    5.0000    4.5000
    3.0000    7.0000
    6.0000    6.0000
    4.0000    6.0000
    5.0000    6.5000

>> nsp = size(sp);
>> sn = [1,2;3,5;7,3;3,4;6,2.7;4,3;2,7]

sn =

    1.0000    2.0000
    3.0000    5.0000
    7.0000    3.0000
    3.0000    4.0000
    6.0000    2.7000
    4.0000    3.0000
    2.0000    7.0000

>> nsn = size(sn)

nsn =

     7     2

>> sd = [sp,sn]
错误使用 horzcat
串联的矩阵的维度不一致。

>> sd = [sp;sn]

sd =

    5.0000    4.5000
    3.0000    7.0000
    6.0000    6.0000
    4.0000    6.0000
    5.0000    6.5000
    1.0000    2.0000
    3.0000    5.0000
    7.0000    3.0000
    3.0000    4.0000
    6.0000    2.7000
    4.0000    3.0000
    2.0000    7.0000

>> lsd = [true true true true true false  false  false  false  false  false  false]

lsd =

  1×12 logical 数组

   1   1   1   1   1   0   0   0   0   0   0   0

>> Y = nominal(lsd)

Y =

  1×12 nominal 数组

     true      true      true      true      true      false      false      false      false      false      false      false

>> figure(1);
>> subplot(1,2,1)
>> plot(sp(1:nsp,1),sp(1:nsp,2),'m+');
>> hold on
>> plot(sn(1:nsn,1),sn(1:nsn,2),'c*');
>> subplot(1,2,2)
>> svmStruct = svmtrain(sd,Y,'Kernel_Function','rbf','rbf_sigma',0.6,'method','SMO','showplot',true);
警告: svmtrain will be removed in a future release. Use fitcsvm instead.
> In svmtrain (line 230)
>> % use the trained svm (svmStruct) to classify the data
>> RD = svmclassify(svmStruct,sd,'showplot',true)
警告: svmclassify will be removed in a future release. Use the predict method
of an object returned by fitcsvm instead.
> In svmclassify (line 47)

RD =

  12×1 nominal 数组

     true
     true
     true
     true
     true
     false
     false
     false
     false
     false
     false
     false

>> %RD is the classification result vector
高斯分类结果图
(4)对两组图片数据进行分类
>> load('bedroom.mat')
>> load('forest.mat')
>> load('labelset.mat')
>> dataset = [bedroom;MITforest];
>> save dataset.mat dataset
>> %选定训练集和测试集,将第一类的1-5,第二类的11-15作为训练集
>> train_set = [dataset(1:5,:);dataset(11:15,:)];
>> %相应的训练集的标签也要分离出来
>> train_set_labels = [lableset(1:5);lableset(11:15)];
>> %将第一类的6-10,,第二类的16-20作为测试集
>> test_set = [dataset(6:10,:);dataset(16:20,:)];
>> %相应的测试集的标签也要分离出来
>> test_set_labels = [lableset(6:10);lableset(16:20)];
>> %数据预处理,将训练集和测试集归一化到[0,1]区间
>> [mtrain,ntrain] = size(train_set);
>> [mtest,ntest] = size(test_set);
>> test_dataset = [train_set;test_set];
>> %mapminmax 为matlab自带的归一化函数
>> [dataset_scale,ps] = mapminmax (test_dataset,0,1);
>> dataset_scale = dataset_scale;
>> train_set = dataset_scale(1:mtrain,:);
>> test_set = dataset_scale((mtrain+1):(mtrain+mtest),:);
>> %SVM网络训练
>> model = svmtrain(train_set_labels,train_set,'-s 2-c 1 -g 0.07');
警告: svmtrain will be removed in a future release. Use fitcsvm instead.
> In svmtrain (line 230)
错误使用 svmtrain (line 236)
Y must be a vector or a character array.
>> %svm网络训练
>> [predict_label] = svmpredict(test_set_labels,test_set,model);
未定义函数或变量 'model'。
>> model = svmtrain(train_set_labels,train_set,'-s 2-c 1 -g 0.07');
警告: svmtrain will be removed in a future release. Use fitcsvm instead.
> In svmtrain (line 230)
错误使用 svmtrain (line 236)
Y must be a vector or a character array.
>> model = svmtrain(train_set_labels,train_set,'-s 2 -c 1 -g 0.07');
警告: svmtrain will be removed in a future release. Use fitcsvm instead.
> In svmtrain (line 230)
错误使用 svmtrain (line 236)
Y must be a vector or a character array.
>> [dataset_scale,ps] = mapminmax(test_dataset',0,1);
>> dataset_scale = dataset_scale';
>> train_set = dataset_scale(1:mtrain,:);
>> test_set = dataset_scale((mtrain+1):(mtrain+mtest),:);
>> %svm网络训练
>> model = svmtrain(train_set_labels,train_set, '-s 2 -c 1 -g 0.07');
警告: svmtrain will be removed in a future release. Use fitcsvm instead.
> In svmtrain (line 230)
错误使用 svmtrain (line 236)
Y must be a vector or a character array.
>> model = fitcsvm(train_set_labels,train_set, '-s 2 -c 1 -g 0.07');
错误使用 internal.stats.parseArgs (line 42)
Wrong number of arguments.
出错 classreg.learning.paramoptim.parseOptimizationArgs (line 5)
[OptimizeHyperparameters,~,~,RemainingArgs] = internal.stats.parseArgs(...
出错 fitcsvm (line 302)
[IsOptimizing, RemainingArgs] =
classreg.learning.paramoptim.parseOptimizationArgs(varargin);
>> model = svmtrain(train_set_labels,train_set, '-s 2 -c 1 -g 0.07');
*
optimization finished, #iter = 3
obj = 9.208867, rho = 3.781010
nSV = 6, nBSV = 4
>> [predict_label] = svmpredict(test_set_labels,test_set,model);
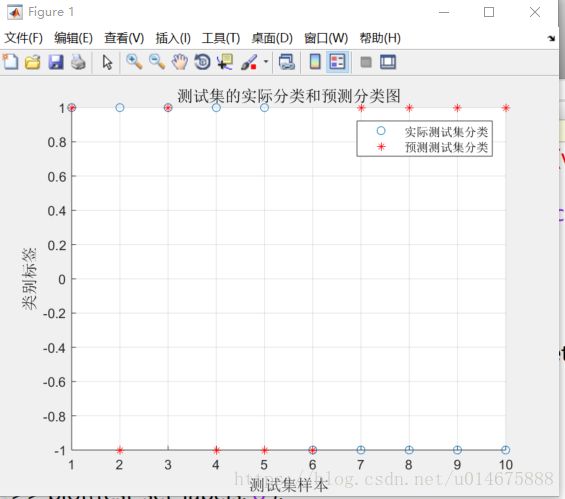
Accuracy = 30% (3/10) (classification)
>> %结果
>> figure;
>> hold on;
>> plot(test_set_labels,'o');
>> plot(predict_labels,'r*');
未定义函数或变量 'predict_labels'。
是不是想输入:
>> plot(predict_label,'r*');
>> xlabel('测试集样本‘,’FontSize‘,12);
xlabel('测试集样本‘,’FontSize‘,12);
↑
错误: 字符向量未正常终止。
>> xlabel ('测试集样本','FontSize',12);
>> ylabel ('类别标签','FontSize',12);
>> legend('实际测试集分类','预测测试集分类');
>> title('测试集的实际分类和预测分类图','FontSize',12);
>> grid on;
>>
**出现问题**
> model = svmtrain(train_set_labels,train_set, '-s 2 -c 1 -g 0.07');
警告: svmtrain will be removed in a future release. Use fitcsvm instead.
> In svmtrain (line 230)
错误使用 svmtrain (line 236)
Y must be a vector or a character array.出现问题
> model = svmtrain(train_set_labels,train_set, '-s 2 -c 1 -g 0.07');
警告: svmtrain will be removed in a future release. Use fitcsvm instead.
> In svmtrain (line 230)
错误使用 svmtrain (line 236)
Y must be a vector or a character array.
解决办法
出现这个问题是因为libsvm的路径不对。解决办法是,将数据加载到matlab的工作区,然后将文件路径指到libsvm的路径即可。我这里是C:\Program Files\MATLAB\R2017b\toolbox\libsvm-3.23
分类准确率只有30%
图片数据分类结果图


