2019独角兽企业重金招聘Python工程师标准>>> ![]()
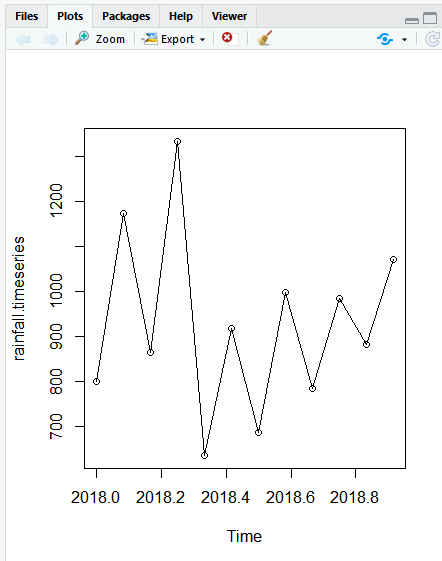
问题描述:使用plot方法画折线图,在Rstudio的Plots中没有显示出来,显示的空白
代码如下:
# Get the data points in form of a R vector.
rainfall <- c(799,1174.8,865.1,1334.6,635.4,918.5,685.5,998.6,784.2,985,882.8,1071)
# Convert it to a time series object.
rainfall.timeseries <- ts(rainfall,start = c(2018,1),frequency = 12)
# Print the timeseries data.
print(rainfall.timeseries)
# Give the chart file a name.
png(file = "rainfall.png")
# Plot a graph of the time series.
plot(rainfall.timeseries,type = "o")
# Save the file.
dev.off()
解决办法:将
# Give the chart file a name.
png(file = "rainfall.png")
放置到plot后
# Get the data points in form of a R vector.
rainfall <- c(799,1174.8,865.1,1334.6,635.4,918.5,685.5,998.6,784.2,985,882.8,1071)
# Convert it to a time series object.
rainfall.timeseries <- ts(rainfall,start = c(2018,1),frequency = 12)
# Print the timeseries data.
print(rainfall.timeseries)
# Plot a graph of the time series.
plot(rainfall.timeseries,type = "o")
# Give the chart file a name.
png(file = "rainfall.png")
# Save the file.
dev.off()
