scikit-learn机器学习(二)--岭回归,Lasso回归和ElasticNet回归
scikit-learn机器学习(一)–多元线性回归模型
scikit-learn机器学习(二)–岭回归,Lasso回归和ElasticNet回归
scikit-learn机器学习(三)–逻辑回归和线性判别分析LDA
多元线性回归模型中,为了是均方差误差最小化,常见的做法是引入正则化,正则化就是给对模型的参数或者说是系数添加一些先验假设,控制模型的空间,使模型的复杂度较小。
正则化目的:防止过拟合
正则化本质:约束要优化的参数
正则化会保留样本的所有特征向量,但是会减少样本特征的数量级
关于正则化参考下面这篇博客:
https://blog.csdn.net/kinghannah/article/details/52065924
岭回归,Lasso回归和ElasticNet回归是常见的线性回归正则化方法,方法如下:
不同之处:
岭回归是在损失函数中加入L2范数惩罚项来控制模型的复杂度
Lasso回归是基于L1范数的
ElasticNet是岭回归和Lasso回归的融合,利用了L1和L2范数
L1范数和L2范数都可以用来度量向量间的差异,但是两者不同:
L1范数:
表示向量x中非零元素的的绝对值之和,又称为曼哈顿距离,最小绝对误差等,
用于度量向量间差异,如:绝对误差和

x1和x2为两个向量
L1范数功能:
可以实现特征稀疏,去掉一些没有信息的特征
**L2范数:
表示向量x中元素的平方和再开平方,如欧式距离,度量向量间差异,如平方差和
![]()
L2范数功能:
防止模型为了迎合模型训练而过于复杂出现过拟合能力,提高模型的泛化能力。
关于常见的范数介绍:
https://blog.csdn.net/shijing_0214/article/details/51757564
上面主要介绍了关于正则化和范数的问题,下面进入正题:
一丶岭回归
在scikit-learn中Ridge类实现了岭回归模型,依旧利用之前的糖尿病人数据样本集
python实现:
from sklearn import datasets,linear_model,discriminant_analysis
import numpy as np
import matplotlib.pyplot as plt
from sklearn.model_selection import train_test_split

#加载数据
def load_data():
    diabetes=datasets.load_diabetes()
    return train_test_split(diabetes.data,diabetes.target,test_size=0.25,random_state=0)

#定义岭回归模型
def test_Ridge(*data):
    x_train,y_train,x_test,y_test=data
    regr=linear_model.Ridge()
    regr.fit(x_train,y_train)
     print('Coefficients:%s,intercept %.2f' % (regr.coef_, regr.intercept_))
    print("Residual sum of square:%.2f" % np.mean((regr.predict(x_test) - y_test) ** 2))
    print('Score:%.2f' % regr.score(x_test, y_test))
    plt.grid()
    plt.show()
x_train,x_test,y_train,y_test=load_data()
test_ridge(x_train,x_test,y_train,y_test)与前面多元线性回归结果差不多
Ridge类中默认的正则化占比为alpha=1,我们可以修改alpha的值,alpha值越大正则化想的占比越大
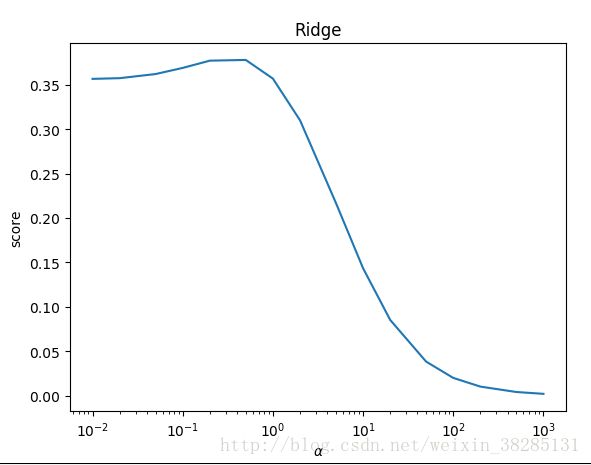
不同alpha值,对预测性能的影响不同,给出检测代码:
def test_Ridge_alpha(*data):
    x_train, x_test, y_train, y_test = data
    alphas=[0.01,0.02,0.05,0.1,0.2,0.5,1,2,5,10,20,50,100,200,500,1000]#alpha列表
    scores=[]#预测性能
    for each in alphas:
        regr = linear_model.Ridge(alpha=each)
        regr.fit(x_train, y_train)
        score=regr.score(x_test,y_test)
        scores.append(score)
    #画图
    fig=plt.figure()
    ax=fig.add_subplot(1,1,1)
    ax.plot(alphas,scores)
    ax.set_xlabel(r"$\alpha$")
    ax.set_ylabel(r"score")
    ax.set_xscale('log')
    ax.set_title("Ridge")
plt.show()二丶Lasso回归
python代码:
只需要换掉regr=linear_model.Ridge()换成Lasso即可
def test_Lasso(*data):
    x_train, x_test, y_train, y_test = data
    regr=linear_model.Lasso()
    regr.fit(x_train,y_train)
    print('Coefficients:%s,intercept %.2f' % (regr.coef_, regr.intercept_))
    print("Residual sum of square:%.2f" % np.mean((regr.predict(x_test) - y_test) ** 2))
    print('Score:%.2f' % regr.score(x_test, y_test))
    plt.grid()
plt.show()三丶ElasticNet回归
ElasticNet回归是利用了L1和L2范数的融合,所以在参数中除了alpha之外还有L1_ratio
默认alpha=1,l1_ratio=0.5
python代码:
def test_ElasticNet(*data):
    x_train, x_test, y_train, y_test = data
    regr=linear_model.ElasticNet()
    regr.fit(x_train,y_train)
    print('Coefficients:%s,intercept %.2f' % (regr.coef_, regr.intercept_))
    print("Residual sum of square:%.2f" % np.mean((regr.predict(x_test) - y_test) ** 2))
    print('Score:%.2f' % regr.score(x_test, y_test))
    plt.grid()
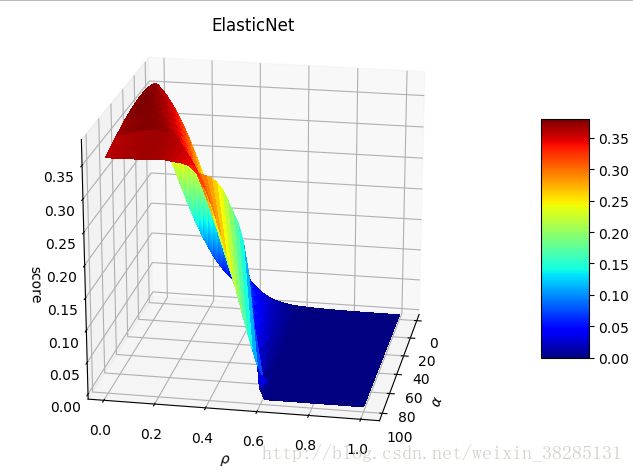
plt.show()不通alpha值和L1_ratio值对性能的影响:
python代码:
def test_ElasticNet_alpha_l1( *data):
    x_train, x_test, y_train, y_test = data
    alphas=np.logspace(-2,2)
    rhos=np.linspace(0.01,1)
    scores=[]
    for i in alphas:
        for j in rhos:
            regr=linear_model.ElasticNet(alpha=i,l1_ratio=j)
            regr.fit(x_train,y_train)
            scores.append(regr.score(x_test,y_test))
    ##绘图
    alphas,rhos=np.meshgrid(alphas,rhos)
    scores=np.array(scores).reshape(alphas.shape)
    from mpl_toolkits.mplot3d import Axes3D
    from matplotlib import cm
    fig=plt.figure()
    ax=Axes3D(fig)
    surf=ax.plot_surface(alphas,rhos,scores,rstride=1,cstride=1,cmap=cm.jet,linewidth=0,antialiased=False)
    fig.colorbar(surf,shrink=0.5,aspect=5)
    ax.set_title('ElasticNet')
    ax.set_xlabel(r"$\alpha$")
    ax.set_ylabel(r"$\rho$")
    ax.set_zlabel("score")
plt.show()本博客主要参考:
《Python大战机器学习》


