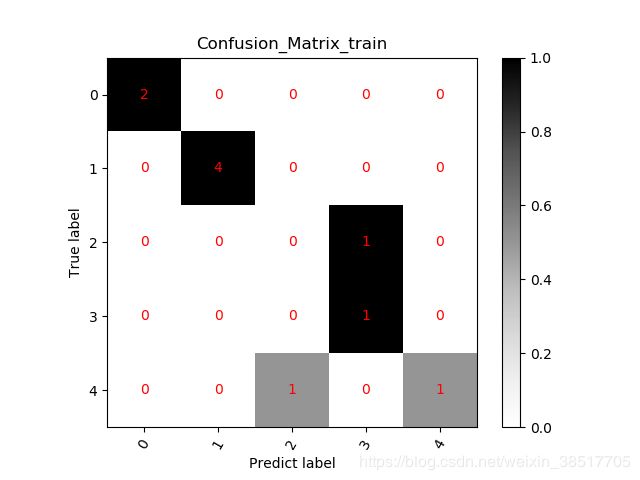
混淆矩阵生成及其可视化
目的:传入两个数组(真实值和预测结果),计算混淆矩阵并使用matplotlib可视化出来
参考自《PyTorch 模型训练实用教程》 作者:余霆嵩 https://github.com/tensor-yu/PyTorch_Tutorial
import numpy as np
import os
import matplotlib.pyplot as plt
cls_num=5
labels=[0,1,3,4,1,1,1,0,4,2]
predicted=[0,1,3,4,1,1,1,0,2,3]
# 第一步:创建混淆矩阵
# 获取类别数,创建 N*N 的零矩阵
conf_mat = np.zeros([cls_num, cls_num])
# 第二步:获取真实标签和预测标签
# labels 为真实标签,通常为一个 batch 的标签
# predicted 为预测类别,与 labels 同长度
# 第三步:依据标签为混淆矩阵计数
for i in range(len(labels)):
	true_i = np.array(labels[i])
	pre_i = np.array(predicted[i])
	conf_mat[true_i, pre_i] += 1.0
print(conf_mat)
#----------------RuntimeWarning: invalid value encountered in true_divide----------#
np.seterr(divide='ignore',invalid='ignore')

def show_confMat(confusion_mat, classes_name, set_name, out_dir):
    """
    可视化混淆矩阵,保存png格式
    :param confusion_mat: nd-array
    :param classes_name: list,各类别名称
    :param set_name: str, eg: 'valid', 'train'
    :param out_dir: str, png输出的文件夹
    :return:
    """
    # 归一化
    confusion_mat_N = confusion_mat.copy()
    for i in range(len(classes_name)):
        confusion_mat_N[i, :] = confusion_mat[i, :] / confusion_mat[i, :].sum()

    # 获取颜色
    cmap = plt.cm.get_cmap('Greys')  # 更多颜色: http://matplotlib.org/examples/color/colormaps_reference.html
    plt.imshow(confusion_mat_N, cmap=cmap)
    plt.colorbar()

    # 设置文字
    xlocations = np.array(range(len(classes_name)))
    plt.xticks(xlocations, classes_name, rotation=60)
    plt.yticks(xlocations, classes_name)
    plt.xlabel('Predict label')
    plt.ylabel('True label')
    plt.title('Confusion_Matrix_' + set_name)

    # 打印数字
    for i in range(confusion_mat_N.shape[0]):
        for j in range(confusion_mat_N.shape[1]):
            plt.text(x=j, y=i, s=int(confusion_mat[i, j]), va='center', ha='center', color='red', fontsize=10)
    # 保存
    plt.savefig(os.path.join(out_dir, 'Confusion_Matrix_' + set_name + '.png'))
    plt.close()

#函数调用示例
show_confMat(conf_mat, [0,1,2,3,4], "train", "./")
