CentOS6.8安装ELK日志平台
ELK日志分析平台环境部署
ELK由ElasticSearch、Logstash和Kiabana三个开源工具组成:
1)ElasticSearch是一个基于Lucene的开源分布式搜索服务器。它的特点有:分布式,零配置,自动发现,索引自动分片,索引副本机制,restful风格接口,多数据源,自动搜索负载等。它提供了一个分布式多用户能力的全文搜索引擎,基于RESTful web接口。Elasticsearch是用Java开发的,并作为Apache许可条款下的开放源码发布,是第二流行的企业搜索引擎。设计用于云计算中,能够达到实时搜索,稳定,可靠,快速,安装使用方便。 在elasticsearch中,所有节点的数据是均等的。
2)Logstash是一个完全开源的工具,它可以对你的日志进行收集、过滤、分析,支持大量的数据获取方法,并将其存储供以后使用(如搜索)。说到搜索,logstash带有一个web界面,搜索和展示所有日志。一般工作方式为c/s架构,client端安装在需要收集日志的主机上,server端负责将收到的各节点日志进行过滤、修改等操作在一并发往elasticsearch上去。
3)Kibana 是一个基于浏览器页面的Elasticsearch前端展示工具,也是一个开源和免费的工具,Kibana可以为 Logstash 和 ElasticSearch 提供的日志分析友好的 Web 界面,可以帮助您汇总、分析和搜索重要数据日志。
本次实验ELK均部署在192.168.0.68机器上。
Elasticsearch安装配置
1、下载并安装GPG Key
[root@elk ~]# rpm --import https://packages.elastic.co/GPG-KEY-elasticsearch
2、添加yum仓库
[root@elk ~]# vim /etc/yum.repos.d/elasticsearch.repo
[elasticsearch-2.x]
name=Elasticsearch repository for 2.x packages
baseurl=http://packages.elastic.co/elasticsearch/2.x/centos
gpgcheck=1
gpgkey=http://packages.elastic.co/GPG-KEY-elasticsearch
enabled=1
3、安装elasticsearch
[root@elk ~]# yum install -y java
java的版本要求1.8.0以上
[root@elk ~]# java -version
openjdk version "1.8.0_201"
OpenJDK Runtime Environment (build 1.8.0_201-b09)
OpenJDK 64-Bit Server VM (build 25.201-b09, mixed mode)
[root@elk ~]# yum install -y elasticsearch
[root@elk ~]# mkdir -p /data/es-data
[root@elk ~]# mkdir -p /data/es-log
[root@elk ~]# vim /etc/elasticsearch/elasticsearch.yml
cluster.name: elk
node.name: master-node
path.data: /data/es-data
path.logs: /data/es-log
bootstrap.mlockall: true
network.host: 0.0.0.0
http.port: 9200
[root@elk ~]# chown -R elasticsearch:elasticsearch /data/
[root@elk ~]# /etc/init.d/elasticsearch start
如果报“daemon: command not found”错误,则执行以下命令
[root@elk ~]# yum install cups cups-lpd
[root@elk ~]# /etc/init.d/elasticsearch start

查看9200端口是否被监听,被监听则服务启动成功!
[root@elk ~]# netstat -ntpl | grep 9200
4、安装插件
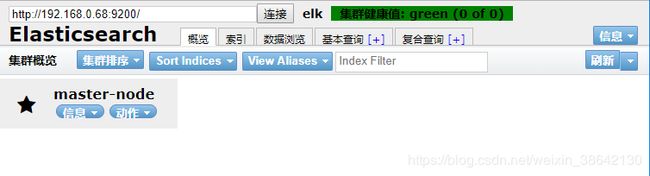
安装head插件
[root@elk ~]# /usr/share/elasticsearch/bin/plugin install mobz/elasticsearch-head
[root@elk ~]# chown -R elasticsearch:elasticsearch /usr/share/elasticsearch/plugins
访问链接:http://192.168.0.68:9200/_plugin/head/可以使用该插件
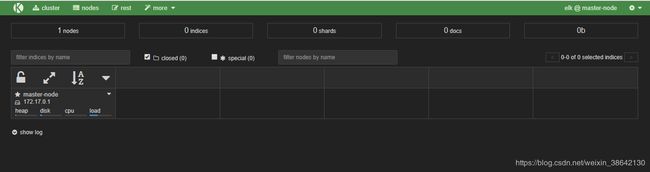
安装kopf监控插件
[root@elk ~]# /usr/share/elasticsearch/bin/plugin install lmenezes/elasticsearch-kopf
[root@elk ~]# chown -R elasticsearch:elasticsearch /usr/share/elasticsearch/plugins
访问链接:http://192.168.0.68:9200/_plugin/kopf/#!/cluster可以使用该插件
Logstash安装配置
1、添加yum仓库
[root@elk ~]# vim /etc/yum.repos.d/logstash.repo
[logstash-2.1]
name=Logstash repository for 2.1.x packages
baseurl=http://packages.elastic.co/logstash/2.1/centos
gpgcheck=1
gpgkey=http://packages.elastic.co/GPG-KEY-elasticsearch
enabled=1
2、安装logstash
[root@elk ~]# yum install -y logstash
3、logstash启动
[root@elk ~]# /etc/init.d/logstash start
4、数据测试
1)基本的输入输出
[root@elk ~]# /opt/logstash/bin/logstash -e 'input { stdin{} } output { stdout{} }'
Settings: Default filter workers: 1
Logstash startup completed
2019-03-26T13:50:58.920Z 94d4a1304c8f
hello
2019-03-26T13:51:04.617Z 94d4a1304c8f hello
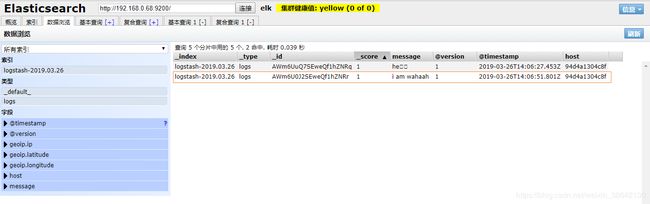
2)把内容写到elasticsearch
[root@elk ~]# /opt/logstash/bin/logstash -e 'input { stdin{} } output { elasticsearch { hosts => ["192.168.0.68:9200"]} }'
Settings: Default filter workers: 1
Logstash startup completed
i am wahaah
然后打开http://192.168.0.68:9200/_plugin/head/,数据浏览可以观察到,logstash已经把数据写入到了elasticsearch中。
5、配置文件的编写
/opt/logstash/bin/logstash -e 'input { stdin{} } output { elasticsearch { hosts => ["192.168.0.68:9200"]} }'
可以把以上命令-e后的参数,写到配置文件中,如下:
[root@elk ~]# vim /etc/logstash/conf.d/01-logstash.conf
input { stdin { } }
output {
        elasticsearch { hosts => ["192.168.0.68:9200"]}
}
执行时带-f参数指向配置文件即可。
/opt/logstash/bin/logstash -f /etc/logstash/conf.d/01-logstash.conf
6、收集系统日志
例子1:
[root@elk ~]# vim case.conf
input {
    file {
      path => "/var/log/messages"
      type => "system"
      start_position => "beginning"
    }
}

output {
    elasticsearch {
       hosts => ["192.168.0.68:9200"]
       index => "system-%{+YYYY.MM.dd}"
    }
}
执行日志信息的收集需要把命令放在后台,命令就会一直执行,如果中断,就表示日志不再收集。
[root@elk ~]# /opt/logstash/bin/logstash -f case.conf &
例子2:
[root@elk ~]# vim case2.conf
input {
    file {
      path => "/var/log/messages"
      type => "system"
      start_position => "beginning"
    }
}

input {
    file {
       path => "/var/log/elasticsearch/huanqiu.log"
       type => "es-error"
       start_position => "beginning"
    }
}


output {
    if [type] == "system"{
        elasticsearch {
           hosts => ["192.168.0.68:9200"]
           index => "system-%{+YYYY.MM.dd}"
        }
    }

    if [type] == "es-error"{
        elasticsearch {
           hosts => ["192.168.0.68:9200"]
           index => "es-error-%{+YYYY.MM.dd}"
        }
    }
}
注意:
如果你的日志中有type字段 那你就不能在conf文件中使用type
执行如下命令收集:
[root@elk ~]# /opt/logstash/bin/logstash -f case2.conf &
7、logstash配置常用的字段
一些常用的输入为:
file:从文件系统的文件中读取,类似于tail -f命令
syslog:在514端口上监听系统日志消息,并根据RFC3164标准进行解析
redis:从redis service中读取
beats:从filebeat中读取
Filters:数据中间处理,对数据进行操作。
一些常见的outputs为:
elasticsearch:可以高效的保存数据,并且能够方便和简单的进行查询。
file:将event数据保存到文件中。
graphite:将event数据发送到图形化组件中,一个很流行的开源存储图形化展示的组件。
Codecs:codecs 是基于数据流的过滤器,它可以作为input,output的一部分配置。Codecs可以帮助你轻松的分割发送过来已经被序列化的数据。
Kibana安装配置
1、下载Kibana
[root@elk ~]# cd /root/soft
[root@elk ~]#
wget https://download.elastic.co/kibana/kibana/kibana-4.3.1-linux-x64.tar.gz
2、安装Kibana
[root@elk ~]# tar -zxvf kibana-4.3.1-linux-x64.tar.gz
[root@elk ~]# mv kibana-4.3.1-linux-x64 /usr/local/kibana
3、配置Kibana
[root@elk ~]# cd /usr/local/kibana/config
[root@elk ~]# cp kibana.yml kibana.yml.bak
[root@elk ~]# vim kibana.yml
server.port: 5601
server.host: "0.0.0.0"
elasticsearch.url: "http://192.168.0.68:9200"
kibana.index: ".kibana"
[root@elk ~]# /usr/local/kibana/bin/kibana
log [18:23:19.867] [info][status][plugin:kibana] Status changed from uninitialized to green - Ready
log [18:23:19.911] [info][status][plugin:elasticsearch] Status changed from uninitialized to yellow - Waiting for Elasticsearch
log [18:23:19.941] [info][status][plugin:kbn_vislib_vis_types] Status changed from uninitialized to green - Ready
log [18:23:19.953] [info][status][plugin:markdown_vis] Status changed from uninitialized to green - Ready

运行kibana成功,因为kibana是运行一直运行在前台的,所以要么选择多开一个窗口,要么选择使用screen
[root@elk ~]# yum -y install screen
打开一个新的终端
[root@elk ~]# screen
[root@elk ~]# /usr/local/kibana/bin/kibana

然后按ctrl+a+d组合键,这样在上面另启的screen屏里,启动的kibana服务就一直运行在前台了。

浏览器访问链接:http://192.168.0.68:5601,查看kibana
四、加入filebeat
Filebeat是一个轻量级的转发和集中日志数据的shipper。用以代替Logstash收集日志信息,可以有效的减轻客户机的压力,Filebeat将收集的日志文件转发到Logstash,然后再由Logstash接收插入到Elasticsearch中,由浏览器打开Kibana,进行日志查看。

1、安装filebeat
[root@elk ~]# cd /root/soft
[root@elk ~]#
wget https://artifacts.elastic.co/downloads/beats/filebeat/filebeat-6.6.2-x86_64.rpm
[root@elk ~]# rpm -ivh filebeat-6.6.2-x86_64.rpm
2、配置filebeat
[root@elk ~]# vim /etc/filebeat/filebeat.yml
filebeat.prospectors:
- type: log
  enabled: true
  paths:
    - /usr/local/nginx/logs/nginx_accrss.log
  fields:
    type: 76-nginx-pclog
output.logstash:
  hosts: "192.168.0.68:5044"
#output.elasticsearch:
#  hosts: ["192.168.0.68:5044"]
#output.file:
#  path: "/tmp/filebeat"
3、配置logstash
[root@elk ~]# vim /etc/logstash/conf.d/logstash.conf
input {
  beats {
    port => 5044
  }
}
output{
  elasticsearch {
    hosts => ["192.168.1.179:9200"]
    index => "%{[fields][type]}-%{+YYYY.MM.dd}"
  }
#  stdout {
#    codec=> rubydebug
#  }
#  file {
#    path => "/path/to/target/file"
#  }
}
4、启动filebeat和logstash
[root@elk ~]# /etc/init.d/logstash restart
[root@elk ~]# /etc/init.d/filebeat start
5、通过Kibana查看
(1)打开链接 http://192.168.0.68:9200/_plugin/head/ ,查看当前存在的索引。

(2)如上图所示,存在索引76-nginx-pclog-*
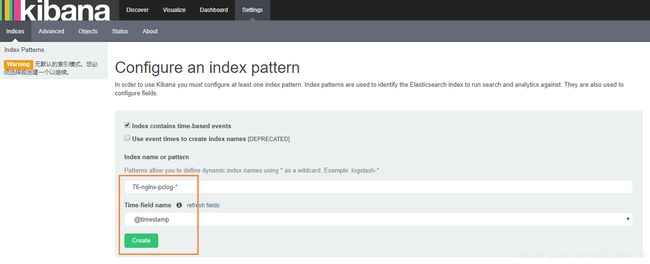
(3)打开链接 http://192.168.0.68:5601 ,添加索引到Kibana以进行查看。
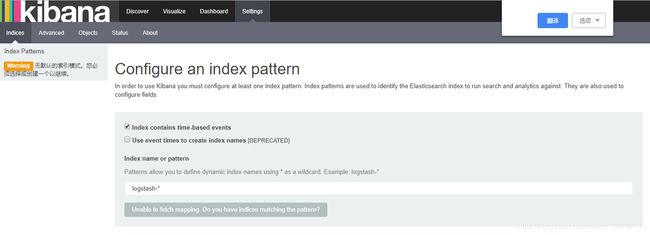
提示无默认索引,我们添加上面的索引到Kibana
(4)点击Discover,即把收集的日志展示如下图所示
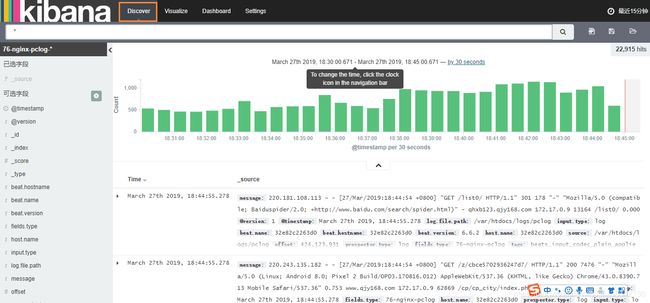
(5)可以点击右上角选择查看的时间区段,以及自动刷新时间,默认不刷新

如果在大型的网络架构中,还可以采用搭建Elasticsearch集群、加入redis等手段来满足业务的需求。
参考链接:
1、ELK实时日志分析平台环境部署
https://www.cnblogs.com/kevingrace/p/5919021.html
2、ELK原理与介绍
https://www.cnblogs.com/aresxin/p/8035137.html