无人驾驶--交通标志检测实战(付源码)
无人驾驶--交通标志检测实战(付源码)
- 前言
- 软硬件要求
- 交通标志牌检测流程
- 图像增强
- 颜色阈值筛选
- 最大极值稳定区域MSER
- 定义交通标志形状的类
- 测试及调试源码
前言
做完项目后写了个技术小结,为他人学习提供参考。
另外建了一个无人驾驶方面的微信交流群,有兴趣的朋友可以加我微信:wxl609278502 请注明: 姓名-单位/学校
项目描述:
使用opencv实时处理车载摄像机采集的道路图像,检测道路交通标志牌,并对交通标志牌进行形状分类,为下一步的交通标志识别提供检测基础。
此项目使用的传统计算机视觉的方法,针对的是没有GPU设备的项目。相对深度学习的交通标志检测和分类存在鲁棒性不够高的问题。
基于深度学习的交通标志牌的检测和分类 会在后续博文中进行整理。
项目代码GitHub地址:https://github.com/xlwang123/Self-Driving_Projects
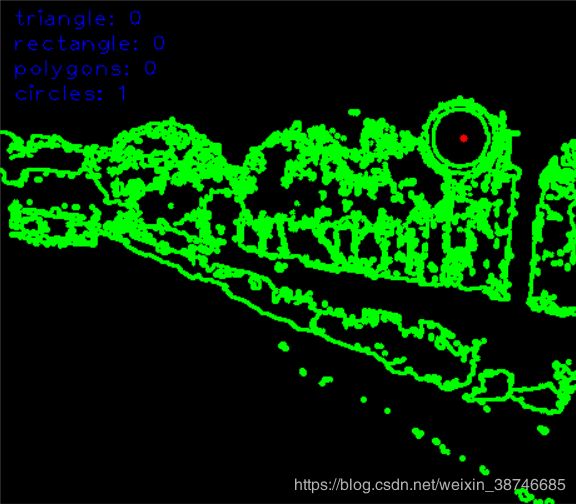
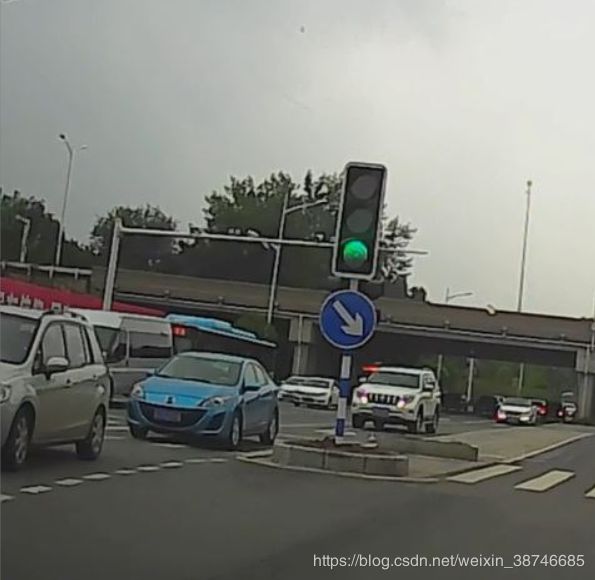
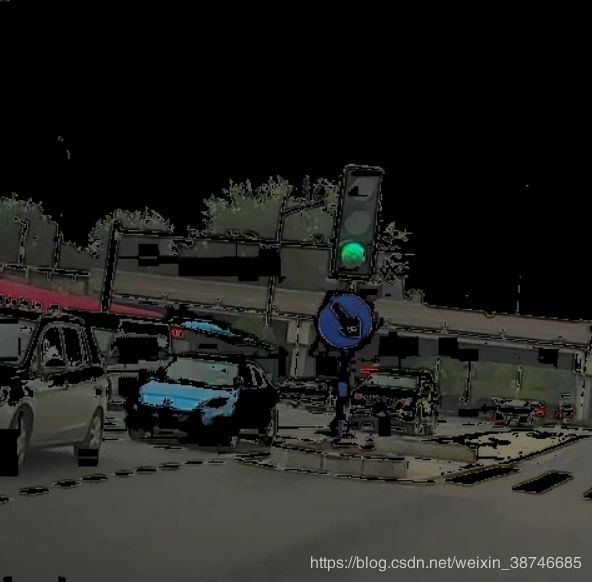
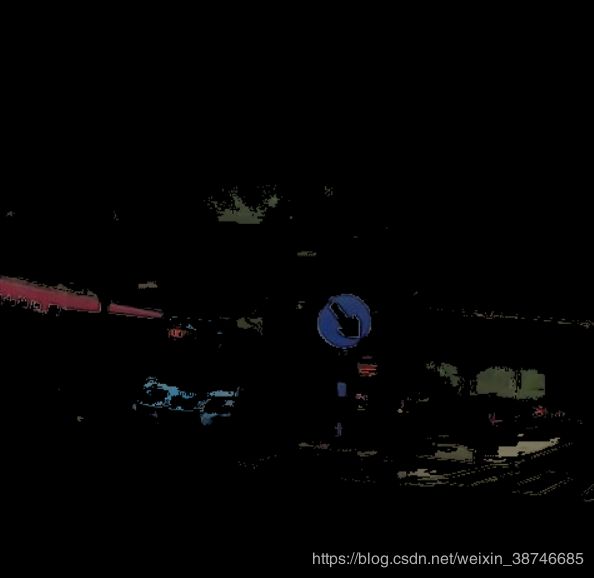
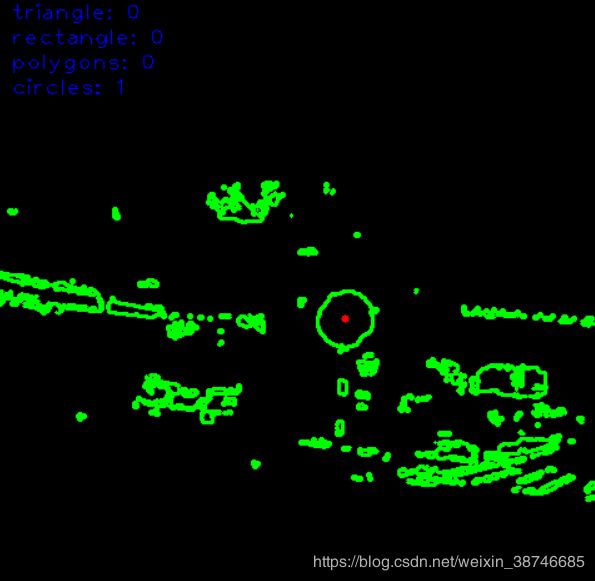
付几张交通标志检测的效果图:
 |
 |
|---|---|
| 原图 | 增强图 |
 |
 |
|---|---|
| 阈值处理 | 几何判断 |
测试地点:南京
软硬件要求
- 普通车载记录仪(要求畸变不严重,对于畸变严重的需要进行图片校正)
- 工控机(带GPU更好,没有GPU也无所谓)
- Ubuntu16.04 + opencv3.2
交通标志牌检测流程
- 基于红黄蓝三色的交通标志牌图像增强
- 基于颜色筛选感兴趣目标
- MSER 最大极值稳定区域
- 基于几何不变矩的颜色筛选
- 结果输出
图像增强
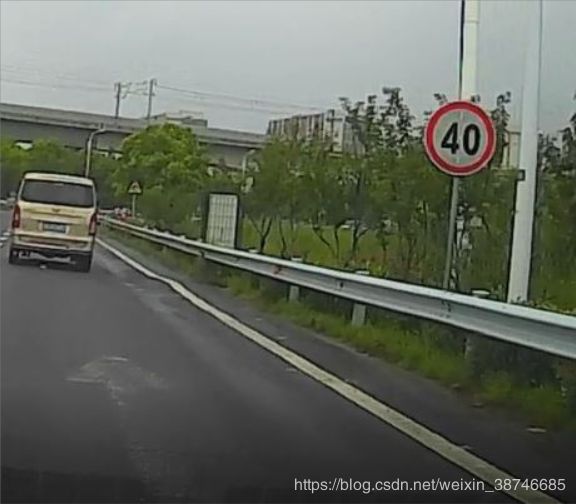
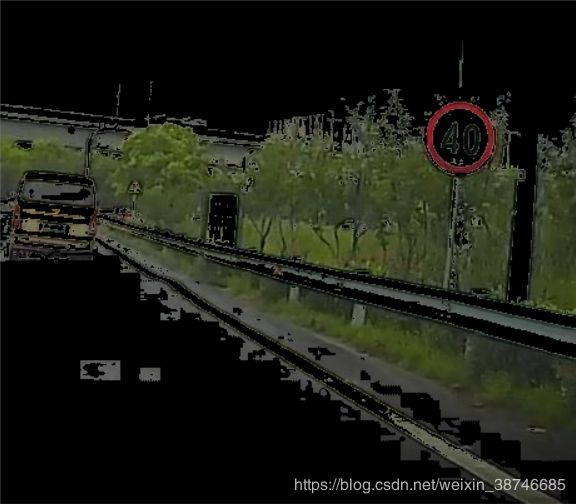
基于三色颜色增强算法,对交通标志牌特有的颜色进行增强,非交通标志牌的颜色进行抑制。
def color_enhance(img):
    height = img.shape[0]
    weight = img.shape[1]
    channels = img.shape[2]
    print("weight : %s, height : %s, channel : %s" % (weight, height, channels))
    for row in range(height):
        for col in range(weight):
            r = img[row, col, 0]
            g = img[row, col, 1]
            b = img[row, col, 2]
            if ((r > 100) & (g > 100) & (b > 100)) | ((abs(r - b) < 25) & (abs(r - g) < 25) & (abs(g - b) < 25) | (
                    (b > g) & (b > r) & (r < g) & (r > 2 * b))):
                img[row, col, :] = 0
            if (2 * (r - g) < (r - b)) & (b > g) & (r > b):
                img[row, col, :] = 0
    return img
颜色增强效果前后对比如图所示:
 |
 |
|---|---|
| 增强前 | 增强后 |
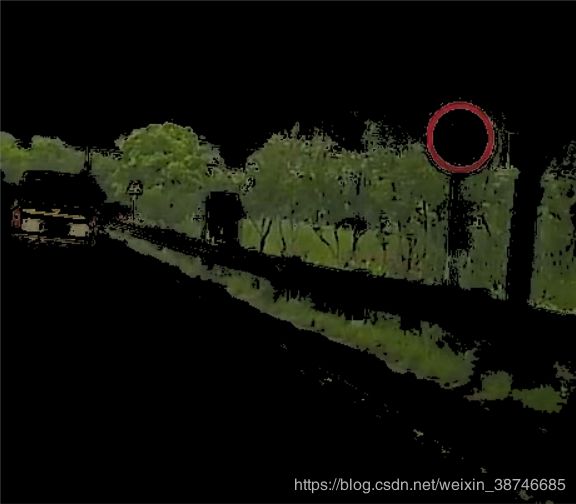
颜色阈值筛选
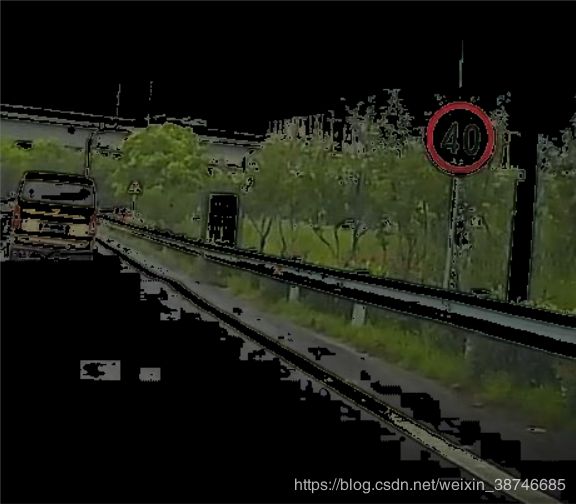
基于红色、黄色、蓝色的HSV阈值进行交通标志的筛选。
def color_select(img):
    lower_blue = np.array([100,40,40])
    upper_blue = np.array([130,255,255])
    lower_yellow = np.array([15,55,55])
    upper_yellow = np.array([50,255,255])
    lower_red1 = np.array([0, 43, 46])
    upper_red1 = np.array([10, 255, 255])
    lower_red2 = np.array([156, 43, 46])
    upper_red2 = np.array([180, 255, 255])
    hsv = cv2.cvtColor(img,cv2.COLOR_BGR2HSV)
    mask_blue = cv2.inRange(hsv, lower_blue, upper_blue)
    mask_yellow = cv2.inRange(hsv, lower_yellow, upper_yellow)
    mask_red1 = cv2.inRange(hsv, lower_red1, upper_red1)
    mask_red2 = cv2.inRange(hsv, lower_red2, upper_red2)
    img_select = cv2.bitwise_and(hsv,hsv,mask= mask_blue + mask_yellow + mask_red1 + mask_red2 )
    img_select = cv2.cvtColor(img_select,cv2.COLOR_HSV2BGR)
    return img_select
颜色筛选效果前后对比如图所示:
 |
 |
|---|---|
| 选择前 | 选择后 |
最大极值稳定区域MSER
MSER有利于避免光照变化的影响,提高算法的稳定性和鲁棒性。
def mser_select(img):
    mser = cv2.MSER_create(_min_area=400)
    gray = cv2.cvtColor(img, cv2.COLOR_BGR2GRAY)
    regions, boxes = mser.detectRegions(gray)
    # num = 0
    # for box in boxes:
        #     num = num + 1
        #     x, y, w, h = box
        #     cv2.rectangle(img, (x, y), (x + w, y + h), (255, 0, 0), 2)
        #     region = img[x:x+int(1.5*w), y:y+int(1.5*h)]
        #     cv2.imshow("region",region)
        #     trafficsign = ShapeAnalysis()
        #     trafficsign.analysis(region)
    # print(num)
    return img,boxes
定义交通标志形状的类
基于几何不变矩对交通标志的形状进行分类。
class ShapeAnalysis:
    def __init__(self):
        self.shapes = {'triangle': 0, 'rectangle': 0, 'polygons': 0, 'circles': 0}

    def analysis(self,frame):
        h, w, ch = frame.shape
        result = np.zeros((h, w, ch), dtype=np.uint8)
        # 二值化图像
        print("start to detect lines...\n")
        gray = cv2.cvtColor(frame, cv2.COLOR_BGR2GRAY)
        binary = cv2.Canny(gray, 50, 150)
        #ret, binary = cv2.threshold(gray, 250, 255, cv2.THRESH_BINARY_INV | cv2.THRESH_OTSU)
        cv2.imshow("binary", binary)

        contours, hierarchy = cv2.findContours(binary, cv2.RETR_EXTERNAL, cv2.CHAIN_APPROX_SIMPLE)
        for cnt in range(len(contours)):
            # 提取与绘制轮廓
            cv2.drawContours(result, contours, cnt, (0, 255, 0), 2)
            area = cv2.contourArea(contours[cnt])
            # 轮廓逼近
            epsilon = 0.01 * cv2.arcLength(contours[cnt], True)
            approx = cv2.approxPolyDP(contours[cnt], epsilon, True)

            # 分析几何形状
            if (area>500):
                corners = len(approx)
                shape_type = ""
                if (corners == 3):
                    count = self.shapes['triangle']
                    count = count + 1
                    self.shapes['triangle'] = count
                    shape_type = "三角形"
                if (corners == 4):
                    count = self.shapes['rectangle']
                    count = count + 1
                    self.shapes['rectangle'] = count
                    shape_type = "矩形"
                if (corners >= 15):
                    count = self.shapes['circles']
                    count = count + 1
                    print(count)
                    self.shapes['circles'] = count
                    shape_type = "圆形"
                if (4 < corners < 15):
                    count = self.shapes['polygons']
                    count = count + 1
                    self.shapes['polygons'] = count
                    shape_type = "多边形"

                # 求解中心位置
                mm = cv2.moments(contours[cnt])
                if mm['m00'] != 0:
                    cx = int(mm['m10'] / mm['m00'])
                    cy = int(mm['m01'] / mm['m00'])
                    cv2.circle(result, (cx, cy), 3, (0, 0, 255), -1)

                    # 颜色分析
                    color = frame[cy][cx]
                    color_str = "(" + str(color[0]) + ", " + str(color[1]) + ", " + str(color[2]) + ")"

                    # 计算面积与周长
                    p = cv2.arcLength(contours[cnt], True)
                    area = cv2.contourArea(contours[cnt])

                    print("周长: %.3f, 面积: %.3f 颜色: %s 形状: %s " % (p, area, color_str, shape_type))

        cv2.imshow("Analysis Result", self.draw_text_info(result))
        return self.shapes

    def draw_text_info(self, image):
        c1 = self.shapes['triangle']
        c2 = self.shapes['rectangle']
        c3 = self.shapes['polygons']
        c4 = self.shapes['circles']
        cv2.putText(image, "triangle: " + str(c1), (10, 20), cv2.FONT_HERSHEY_PLAIN, 1.2, (255, 0, 0), 1)
        cv2.putText(image, "rectangle: " + str(c2), (10, 40), cv2.FONT_HERSHEY_PLAIN, 1.2, (255, 0, 0), 1)
        cv2.putText(image, "polygons: " + str(c3), (10, 60), cv2.FONT_HERSHEY_PLAIN, 1.2, (255, 0, 0), 1)
        cv2.putText(image, "circles: " + str(c4), (10, 80), cv2.FONT_HERSHEY_PLAIN, 1.2, (255, 0, 0), 1)
        return image
测试及调试源码
基于几何不变矩对交通标志的形状进行分类。
#! /usr/bin/env python
# -*- coding: utf-8 -*-
# __author__ = "XiaolongWang"
# Date: 2019/3/22

import os
import cv2
import numpy as np
from PIL import Image

#----------------------color enhancement-----------------------#
#--------------------------------------------------------------#
def color_enhance(img):
    height = img.shape[0]
    weight = img.shape[1]
    channels = img.shape[2]
    print("weight : %s, height : %s, channel : %s" % (weight, height, channels))
    for row in range(height):
        for col in range(weight):
            r = img[row, col, 0]
            g = img[row, col, 1]
            b = img[row, col, 2]
            if ((r > 100) & (g > 100) & (b > 100)) | ((abs(r - b) < 25) & (abs(r - g) < 25) & (abs(g - b) < 25) | (
                    (b > g) & (b > r) & (r < g) & (r > 2 * b))):
                img[row, col, :] = 0
            if (2 * (r - g) < (r - b)) & (b > g) & (r > b):
                img[row, col, :] = 0
    return img

#------------------------color select--------------------------#
#--------------------------------------------------------------#
def color_select(img):
    lower_blue = np.array([100,40,40])
    upper_blue = np.array([130,255,255])
    lower_yellow = np.array([15,55,55])
    upper_yellow = np.array([50,255,255])
    lower_red1 = np.array([0, 43, 46])
    upper_red1 = np.array([10, 255, 255])
    lower_red2 = np.array([156, 43, 46])
    upper_red2 = np.array([180, 255, 255])
    hsv = cv2.cvtColor(img,cv2.COLOR_BGR2HSV)
    mask_blue = cv2.inRange(hsv, lower_blue, upper_blue)
    mask_yellow = cv2.inRange(hsv, lower_yellow, upper_yellow)
    mask_red1 = cv2.inRange(hsv, lower_red1, upper_red1)
    mask_red2 = cv2.inRange(hsv, lower_red2, upper_red2)
    img_select = cv2.bitwise_and(hsv,hsv,mask= mask_blue + mask_yellow + mask_red1 + mask_red2 )
    img_select = cv2.cvtColor(img_select,cv2.COLOR_HSV2BGR)
    return img_select

#----------------------------MSER------------------------------#
#--------------------------------------------------------------#
def mser_select(img):
    mser = cv2.MSER_create(_min_area=400)
    gray = cv2.cvtColor(img, cv2.COLOR_BGR2GRAY)
    regions, boxes = mser.detectRegions(gray)
    # num = 0

    # for box in boxes:
        #     num = num + 1
        #     x, y, w, h = box
        #     cv2.rectangle(img, (x, y), (x + w, y + h), (255, 0, 0), 2)
        #     region = img[x:x+int(1.5*w), y:y+int(1.5*h)]
        #     cv2.imshow("region",region)
        #     trafficsign = ShapeAnalysis()
        #     trafficsign.analysis(region)
    # print(num)
    return img,boxes

#----------------------shape classify-------------------------#
#--------------------------------------------------------------#
class ShapeAnalysis:
    def __init__(self):
        self.shapes = {'triangle': 0, 'rectangle': 0, 'polygons': 0, 'circles': 0}

    def analysis(self,frame):
        h, w, ch = frame.shape
        result = np.zeros((h, w, ch), dtype=np.uint8)
        # 二值化图像
        print("start to detect lines...\n")
        gray = cv2.cvtColor(frame, cv2.COLOR_BGR2GRAY)
        binary = cv2.Canny(gray, 50, 150)
        #ret, binary = cv2.threshold(gray, 250, 255, cv2.THRESH_BINARY_INV | cv2.THRESH_OTSU)
        cv2.imshow("binary", binary)

        contours, hierarchy = cv2.findContours(binary, cv2.RETR_EXTERNAL, cv2.CHAIN_APPROX_SIMPLE)
        for cnt in range(len(contours)):
            # 提取与绘制轮廓
            cv2.drawContours(result, contours, cnt, (0, 255, 0), 2)

            area = cv2.contourArea(contours[cnt])
            # 轮廓逼近
            epsilon = 0.01 * cv2.arcLength(contours[cnt], True)
            approx = cv2.approxPolyDP(contours[cnt], epsilon, True)

            # 分析几何形状
            if (area>500):
                corners = len(approx)
                shape_type = ""
                if (corners == 3):
                    count = self.shapes['triangle']
                    count = count + 1
                    self.shapes['triangle'] = count
                    shape_type = "三角形"
                if (corners == 4):
                    count = self.shapes['rectangle']
                    count = count + 1
                    self.shapes['rectangle'] = count
                    shape_type = "矩形"
                if (corners >= 15):
                    count = self.shapes['circles']
                    count = count + 1
                    print(count)
                    self.shapes['circles'] = count
                    shape_type = "圆形"
                if (4 < corners < 15):
                    count = self.shapes['polygons']
                    count = count + 1
                    self.shapes['polygons'] = count
                    shape_type = "多边形"

                # 求解中心位置
                mm = cv2.moments(contours[cnt])
                if mm['m00'] != 0:
                    cx = int(mm['m10'] / mm['m00'])
                    cy = int(mm['m01'] / mm['m00'])
                    cv2.circle(result, (cx, cy), 3, (0, 0, 255), -1)

                    # 颜色分析
                    color = frame[cy][cx]
                    color_str = "(" + str(color[0]) + ", " + str(color[1]) + ", " + str(color[2]) + ")"

                    # 计算面积与周长
                    p = cv2.arcLength(contours[cnt], True)
                    area = cv2.contourArea(contours[cnt])

                    print("周长: %.3f, 面积: %.3f 颜色: %s 形状: %s " % (p, area, color_str, shape_type))

        cv2.imshow("Analysis Result", self.draw_text_info(result))
        return self.shapes

    def draw_text_info(self, image):
        c1 = self.shapes['triangle']
        c2 = self.shapes['rectangle']
        c3 = self.shapes['polygons']
        c4 = self.shapes['circles']
        cv2.putText(image, "triangle: " + str(c1), (10, 20), cv2.FONT_HERSHEY_PLAIN, 1.2, (255, 0, 0), 1)
        cv2.putText(image, "rectangle: " + str(c2), (10, 40), cv2.FONT_HERSHEY_PLAIN, 1.2, (255, 0, 0), 1)
        cv2.putText(image, "polygons: " + str(c3), (10, 60), cv2.FONT_HERSHEY_PLAIN, 1.2, (255, 0, 0), 1)
        cv2.putText(image, "circles: " + str(c4), (10, 80), cv2.FONT_HERSHEY_PLAIN, 1.2, (255, 0, 0), 1)
        return image

#-----------------------main function--------------------------#
#--------------------------------------------------------------#
def traffic_sign_detection():
    img = cv2.imread('sign4.JPG')
    img_enhanced = color_enhance(img)
    cv2.imshow('enhanced', img_enhanced)
    img_selected = color_select(img_enhanced)
    cv2.imshow('selected', img_selected)
    mser_selected,boxes = mser_select(img_selected)
    cv2.imshow('mser', mser_selected)
    num = 0
    for box in boxes:
        num = num + 1
        x, y, w, h = box
        print(x,y,w,h)
        region = img[x:int(x+5*w), y:int(y+5*h)]
        cv2.imshow("region",region)
        trafficsign = ShapeAnalysis()
        trafficsign.analysis(region)

    # trafficsign = ShapeAnalysis()
    # trafficsign.analysis(mser_selected)
    cv2.waitKey(0)
    cv2.destroyAllWindows()

    return

def test():
    img = cv2.imread('sign1.JPG')
    cv2.imshow("img",img)
    img_enhanced = color_enhance(img)
    cv2.imshow('enhanced', img_enhanced)
    img_selected = color_select(img_enhanced)
    cv2.imshow('selected', img_selected)
    # region = img[0:200, 0:400]
    # cv2.imshow("region", region)
    gray = cv2.cvtColor(img_selected, cv2.COLOR_BGR2GRAY)
    binary = cv2.Canny(gray,50,150)
    cv2.imshow("binary", binary)
    trafficsign = ShapeAnalysis()
    trafficsign.analysis(img_selected)
    cv2.waitKey(0)
    cv2.destroyAllWindows()

if __name__ == '__main__':
    #traffic_sign_detection()
    test()
