python 手写实现k-means
今天手写实现了k-means,目的是加深对这个算法原理的理解,有不足的地方请多指教。
ris鸢尾花数据集包含3个不同品种的鸢尾花(Setosa,Versicolour,and Virginica)数据,花瓣和萼片长度,存储在一个150*4的 numpy.ndarry中
150行4列,150行指150多花,4列分别是Sepal Length,Sepal Width, Petal Length and Petal Width
使用pandas官方demo
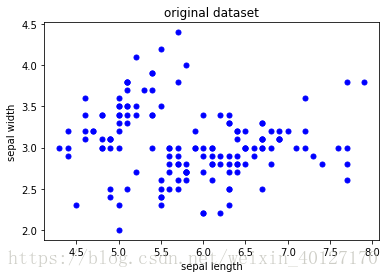
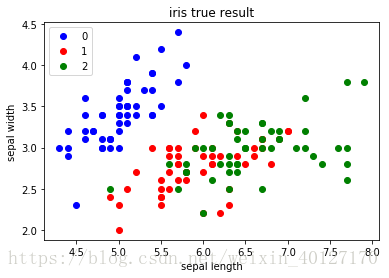
本代码使用k-means实现对莺尾花种类class的区分,最后进行了可视化
导入库
from numpy import *
import matplotlib.pyplot as plt
import pandas as pd
# Load dataset
url = "https://archive.ics.uci.edu/ml/machine-learning-databases/iris/iris.data"
names = ['sepal-length', 'sepal-width', 'petal-length', 'petal-width', 'class']
dataset = pd.read_csv(url, names=names)dataset['class'][dataset['class']=='Iris-setosa']=0
dataset['class'][dataset['class']=='Iris-versicolor']=1
dataset['class'][dataset['class']=='Iris-virginica']=2
#对类别进行编码,3个类别分别赋值0,1,2#算距离
def distEclud(vecA, vecB): #两个向量间欧式距离
return sqrt(sum(power(vecA - vecB, 2))) #la.norm(vecA-vecB)#初始化聚类中心:通过在区间范围随机产生的值作为新的中心点
def randCent(dataSet, k):
#获取特征维度
n = shape(dataSet)[1]
#创建聚类中心0矩阵 k x n
centroids = mat(zeros((k,n)))
#遍历n维特征
for j in range(n):
#第j维特征属性值min ,1x1矩阵
minJ = min(dataSet[:,j])
#区间值max-min,float数值
rangeJ = float(max(dataSet[:,j]) - minJ)
#第j维,每次随机生成k个中心
centroids[:,j] = mat(minJ + rangeJ * random.rand(k,1))
return centroidsdef randChosenCent(dataSet,k):
# 样本数
m=shape(dataSet)[0]
# 初始化列表
centroidsIndex=[]
#生成类似于样本索引的列表
dataIndex=list(range(m))
for i in range(k):
#生成随机数
randIndex=random.randint(0,len(dataIndex))
#将随机产生的样本的索引放入centroidsIndex
centroidsIndex.append(dataIndex[randIndex])
#删除已经被抽中的样本
del dataIndex[randIndex]
#根据索引获取样本
centroids = dataSet.iloc[centroidsIndex]
return mat(centroids)def kMeans(dataSet, k):
# 样本总数
m = shape(dataSet)[0]
#分配样本到最近的簇:存[簇序号,距离的平方]
# m行 2 列
clusterAssment = mat(zeros((m,2)))
#step1:
#通过随机产生的样本点初始化聚类中心
centroids = randChosenCent(dataSet, k)
print('最初的中心=',centroids)
#标志位,如果迭代前后样本分类发生变化值为Tree,否则为False
clusterChanged = True
#查看迭代次数
iterTime=0
#所有样本分配结果不再改变,迭代终止
while clusterChanged:
clusterChanged = False
#step2:分配到最近的聚类中心对应的簇中
for i in range(m):
#初始定义距离为无穷大
minDist = inf;
#初始化索引值
minIndex = -1
# 计算每个样本与k个中心点距离
for j in range(k):
#计算第i个样本到第j个中心点的距离
distJI = distEclud(centroids[j,:],dataSet.values[i,:])
#判断距离是否为最小
if distJI < minDist:
#更新获取到最小距离
minDist = distJI
#获取对应的簇序号
minIndex = j
#样本上次分配结果跟本次不一样,标志位clusterChanged置True
if clusterAssment[i,0] != minIndex:
clusterChanged = True
clusterAssment[i,:] = minIndex,minDist**2 #分配样本到最近的簇
iterTime+=1
sse=sum(clusterAssment[:,1])
print('the SSE of %d'%iterTime + 'th iteration is %f'%sse)
#step3:更新聚类中心
for cent in range(k):#样本分配结束后,重新计算聚类中心
#获取该簇所有的样本点
ptsInClust = dataSet.iloc[nonzero(clusterAssment[:,0].A==cent)[0]]
#更新聚类中心:axis=0沿列方向求均值。
centroids[cent,:] = mean(ptsInClust, axis=0)
return centroids, clusterAssmentdef kMeansSSE(dataSet,k,distMeas=distEclud, createCent=randChosenCent):
m = shape(dataSet)[0]
#分配样本到最近的簇:存[簇序号,距离的平方]
clusterAssment=mat(zeros((m,2)))
#step1:#初始化聚类中心
centroids = createCent(dataSet, k)
print('initial centroids=',centroids)
sseOld=0
sseNew=inf
iterTime=0 #查看迭代次数
while(abs(sseNew-sseOld)>0.0001):
sseOld=sseNew
#step2:将样本分配到最近的质心对应的簇中
for i in range(m):
minDist=inf;minIndex=-1
for j in range(k):
#计算第i个样本与第j个质心之间的距离
distJI=distMeas(centroids[j,:],dataSet.values[i,:])
#获取到第i样本最近的质心的距离,及对应簇序号
if distJI#2维数据聚类效果显示
def datashow(dataSet,k,centroids,clusterAssment): #二维空间显示聚类结果
from matplotlib import pyplot as plt
num,dim=shape(dataSet) #样本数num ,维数dim
if dim!=2:
print('sorry,the dimension of your dataset is not 2!')
return 1
marksamples=['or','ob','og','ok','^r','^b','len(marksamples):
print('sorry,your k is too large,please add length of the marksample!')
return 1
#绘所有样本
for i in range(num):
markindex=int(clusterAssment[i,0])#矩阵形式转为int值, 簇序号
#特征维对应坐标轴x,y;样本图形标记及大小
plt.plot(dataSet.iat[i,0],dataSet.iat[i,1],marksamples[markindex],markersize=6)
#绘中心点
markcentroids=['o','*','^']#聚类中心图形标记
label=['0','1','2']
c=['yellow','pink','red']
for i in range(k):
plt.plot(centroids[i,0],centroids[i,1],markcentroids[i],markersize=15,label=label[i],c=c[i])
plt.legend(loc = 'upper left')
plt.xlabel('sepal length')
plt.ylabel('sepal width')
plt.title('k-means cluster result') #标题
plt.show() #画出实际图像
def trgartshow(dataSet,k,labels):
from matplotlib import pyplot as plt
num,dim=shape(dataSet)
label=['0','1','2']
marksamples=['ob','or','og','ok','^r','^b','#聚类前,绘制原始的样本点
def originalDatashow(dataSet):
#样本的个数和特征维数
num,dim=shape(dataSet)
marksamples=['ob'] #样本图形标记
for i in range(num):
plt.plot(datamat.iat[i,0],datamat.iat[i,1],marksamples[0],markersize=5)
plt.title('original dataset')
plt.xlabel('sepal length')
plt.ylabel('sepal width') #标题
plt.show()if __name__=='__main__':
#=====kmeans聚类
# # #获取样本数据
datamat=dataset.loc[:, ['sepal-length','sepal-width']]
#真实的标签
labels=dataset.loc[:, ['class']]
# #原始数据显示
originalDatashow(datamat)
# #*****kmeans聚类
k=3 #用户定义聚类数
mycentroids,clusterAssment=kMeans(datamat,k)
#mycentroids,clusterAssment=kMeansSSE(datamat,k)
#绘图显示
datashow(datamat,k,mycentroids,clusterAssment)
trgartshow(datamat,3,labels)最初的中心= [[ 5.8 2.7] [ 6.7 3.3] [ 6.3 3.3]] the SSE of 1th iteration is 89.870000 the SSE of 2th iteration is 56.076254 the SSE of 3th iteration is 51.738059 the SSE of 4th iteration is 50.664805 the SSE of 5th iteration is 49.569934 the SSE of 6th iteration is 48.696179 the SSE of 7th iteration is 46.824378 the SSE of 8th iteration is 45.085428 the SSE of 9th iteration is 44.384855 the SSE of 10th iteration is 43.591498 the SSE of 11th iteration is 41.904928 the SSE of 12th iteration is 39.066514 the SSE of 13th iteration is 38.316500 the SSE of 14th iteration is 37.912536 the SSE of 15th iteration is 37.423306 the SSE of 16th iteration is 37.136261 the SSE of 17th iteration is 37.123702

总结:
为了在平面上进行可视化,只选取了4个特征中的2个特征,可能用3个特征会更好,之前在tf的官网上看过minists数据集在tensorboard上的三维画图,挺漂亮的。还不会用matlibplot画3维散点,echarts应该可以。有时间可以尝试一下。
