新冠数据整理和简单分析
新冠数据整理和分析(一)
- 提前准备
- 使用的工具和包
- 数据来源和读取
- 时序分析
- 中国各省确诊时序分析
- 确诊地图可视化
- 世界各国确诊时序分析
- 使用关联网络分析国家间病毒传播
- 基于DCCA生成去趋势互相关矩阵
- 使用Gephi过滤生成中国各省的相关网络
- 使用Gephi过滤生成全球各国相关网络
- 使用小波分析寻找COVID19传播的规律
- 特征提取
- 可视化
- 说明
最近看了Kaggle上对COVID_19的一些kernal,于是本人在他们的工作基础上进行了一些进一步的探讨,希望对大家有所帮助。下文我将简单介绍我在时序分析,复杂网络分析和小波分析三个方面做的一些实验和对分析结果的理解。
提前准备
使用的工具和包
import numpy as np
import pandas as pd
import plotly.graph_objects as go
import plotly.offline as py
import datashader as ds
from colorcet import fire
import datashader.transfer_functions as tf
from plotly.subplots import make_subplots
import plotly.express as px
import matplotlib.image as mpimg
import pywt
我使用的工具主要包括Numpy, Pandas等基础数据处理包,同时也使用了Plotly非常炫酷的可视化API,以便做更好的结果呈现。在网络分析部分,我使用Gephi进行复杂网络分析和可视化,Pywt包为使用Python进行小波分析提供了一些必要的方法。
数据来源和读取
我使用的数据集是由约翰斯·霍普金斯大学(JHU)提供的从2020年1月23日起全球范围统计的新冠病毒数据集。大家可以通过github直接clone到本地,以便后续的分析。以下是下载地址:
COVID_19数据集
接下来我们将下载好的数据加载进Jupyter lab中。我首先加载的数据是确证病例数。
confirmed = pd.read_csv('/COVID-19/archived_data/archived_time_series/time_series_19-covid-Confirmed_archived_0325.csv')
接着,我们将中国的确诊病例数提取出来。
confirmed_China = confirmed[confirmed['Country/Region'] == 'China']
confirmed_China.head(5)
时序分析
中国各省确诊时序分析
接着,我们对中国的确诊数序列进行一系列的可视化。
py.init_notebook_mode(connected=True)
fig = go.Figure()
for index, row in confirmed_China.iterrows():
    fig.add_trace(go.Scatter(x = row.index[4:], y = list(row)[4:], name = row[0], line=dict(width=4)))
fig.update_layout(title='China Province Confimred Case Number',
                   xaxis_title='Date',
                   yaxis_title='Cases')
py.iplot(fig)
fig = go.Figure()
for index, row in confirmed_China.iterrows():
    growing_number = []
    for i in range(len(row[4:]) - 1):
        growing_number.append(row[4 + i + 1] - row[4 + i])
    fig.add_trace(go.Scatter(x = row.index[5:], y = growing_number, name = row[0], line=dict(width=4)))
fig.update_layout(title='China Province Confimred Case Growing Number',
                   xaxis_title='Date',
                   yaxis_title='Cases')
py.iplot(fig)
fig = go.Figure()
for index, row in confirmed_China.iterrows():
    growing_rate = []
    for i in range(len(row[4:]) - 1):
        if row[4 + i] != 0:
            growing_rate.append((row[4 + i + 1] - row[4 + i]) / row[4 + i])
        else:
            growing_rate.append(0)
    fig.add_trace(go.Scatter(x = row.index[5:], y = growing_rate, name = row[0], line=dict(width=4)))
fig.update_layout(title='China Province Confimred Case Growing Rate',
                   xaxis_title='Date',
                   yaxis_title='Cases')
py.iplot(fig)
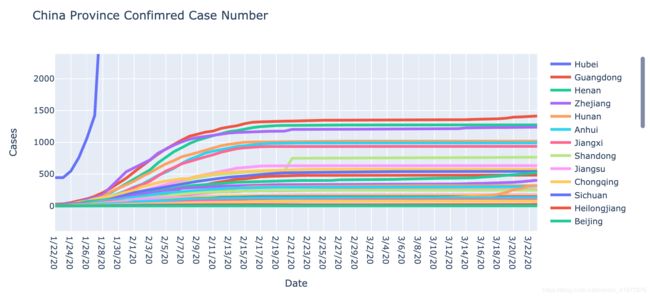
以上我分别绘制了中国各省份累计确诊数,每日确诊数,确诊增长率的折线图。在第一张图中,表示湖北的蓝紫色折现明显与其他折现存在很明显的规律性区别,湖北的确诊病例增幅远高于其他省份,可见在疫情初期湖北省没有做到有效的防控导致疫情自由爆发(指数级)。但是,除湖北以外的其他省份,几乎都以类似分式函数的形式在2月15日达到了峰值,这意味着其他省份的疫情实际上都得到了很有效的控制。
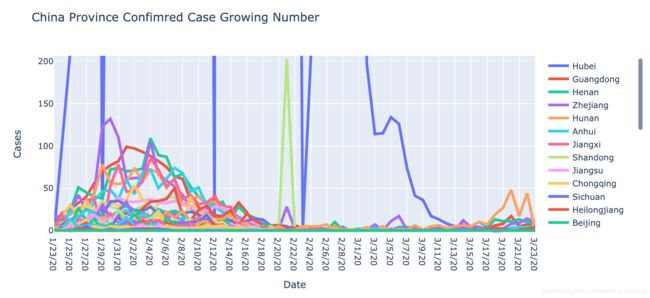
图二是对图一的一阶差分,表示的是每日新增的确诊病例数,在2月2日到2月4日前后各省份的每日确诊数都开始下降,即累积确诊曲线的增长斜率开始减小,由此可见在进行武汉封城等一系列举措后,各省没有进一步的输入病原体(因为该曲线大体是单峰的),而是在省内进行可控的病毒传播。另外在3月末出现的曲线波动,我认为可以归咎是境外输入导致。
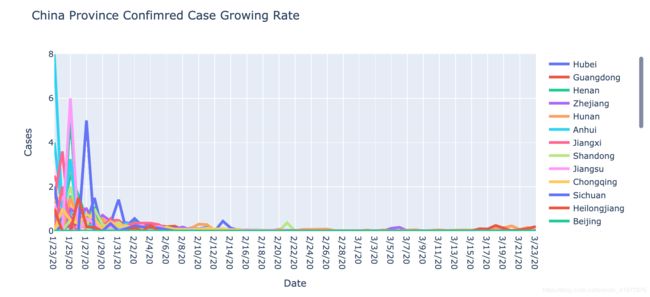
图三是对图一的二阶差分,表示的是每日新增确诊病例的增长率。可以看到一月中下旬各省份的每日确诊增长率就开始快速下降,这进一步的反映了各省内部的防控工作是成功的。
确诊地图可视化
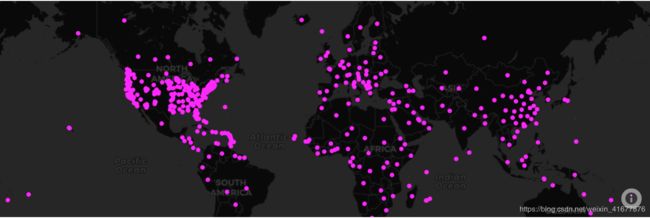
我使用plotly提供的Mapbox绘制函数来完成确诊地图的可视化。
cvs = ds.Canvas(plot_width=1000, plot_height=1000)
agg = cvs.points(confirmed, x='Long', y='Lat')
coords_lat, coords_lon = agg.coords['Lat'].values, agg.coords['Long'].values
coordinates = [[coords_lon[0], coords_lat[0]],
               [coords_lon[-1], coords_lat[0]],
               [coords_lon[-1], coords_lat[-1]],
               [coords_lon[0], coords_lat[-1]]]
img = tf.shade(agg, cmap=fire)[::-1].to_pil()
fig = px.scatter_mapbox(confirmed, lat="Lat", lon="Long", hover_name="Province/State", hover_data=["Country/Region"],
                        color_discrete_sequence=["fuchsia"], zoom=3, height=400)
fig.update_layout(mapbox_style="carto-darkmatter",
                 mapbox_layers = [
                {
                    "sourcetype": "image",
                    "source": img,
                    "coordinates": coordinates
                }]
)
fig.show()
从图上可以看出,美洲和欧洲的情况比亚洲遭。。。。
世界各国确诊时序分析
首先,我们读入一个新的数据表,它提供了更全面的全球疫情数据。
time_series = pd.read_csv('/COVID-19/csse_covid_19_data/csse_covid_19_time_series/time_series_covid19_confirmed_global.csv')
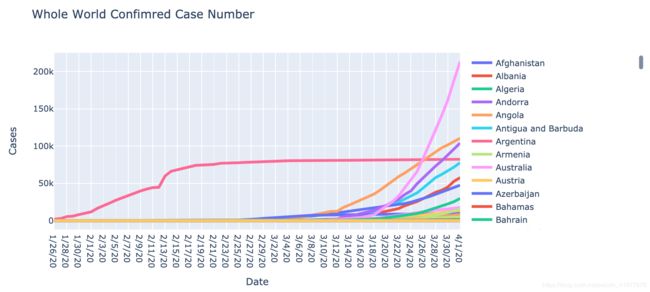
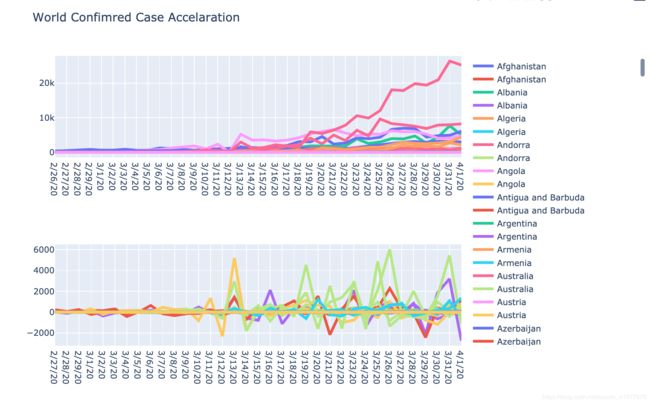
和上文类似的可视化,这里就不赘述了,直接上代码。
confirmed_whole = time_series.groupby('Country/Region').sum()
confirmed_whole = confirmed_whole.drop(columns=['Lat', 'Long'])
fig = go.Figure()
for index, row in confirmed_whole.iterrows():
    fig.add_trace(go.Scatter(x = row.index[4:], y = list(row)[4:], name = row.name, line=dict(width=4)))
fig.update_layout(title='Whole World Confimred Case Number',
                   xaxis_title='Date',
                   yaxis_title='Cases')
py.iplot(fig)
infection_the_world = confirmed_whole[confirmed_whole.columns[34:]]
fig = make_subplots(rows=2, cols=1, vertical_spacing=0.3, specs=[[{"type": "scatter"}], [{"type": "scatter"}]])
for index, row in infection_the_world.iterrows():
    slope = []
    accelarate = []
    for i in range(len(row) - 1):
        slope.append(row[i + 1] - row[i])
    for j in range(len(slope) - 1):
        accelarate.append(slope[j + 1] - slope[j])
    fig.add_trace(go.Scatter(x = row.index[1:], y = slope, name = row.name, line=dict(width=4)), row=1, col=1)
    fig.add_trace(go.Scatter(x = row.index[2:], y = accelarate, name = row.name, line=dict(width=4)), row=2, col=1)
fig.update_layout(title_text='World Confimred Case Accelaration', height=600)
py.iplot(fig)
从上面的三张图我们同样可以解读许多有价值的信息,但是笔者比较懒,而且每个人对同一件事物的理解也不一样,这里就交给大家自行参悟了。
使用关联网络分析国家间病毒传播
国家间如果存在病毒的交叉传播,那么它们的序列(确诊数列)就会产生较高的相关性。打个比方,如果A国病例数增加,那么它向B国输入的感染者的数量就会相应的增加(在不控制的情况下),这些输入的感染者也会在随后的一段时间(一周内),表现在B国的序列上,即导致B国序列的同向变化。这个想法是不是合理其实非常有待商榷,但是不妨作为一种尝试。
基于DCCA生成去趋势互相关矩阵
这个方法的数学原理比较复杂,是一种可以反映非平稳时间序列间的相关性的技术。大家感兴趣的化,可以砸在Google上查Detrended Cross Correlation Analysis就会出来许多相关的文献。这里不赘述了,就直接上代码。
# Return sliding windows
def sliding_window(xx,k):
    # Function to generate boxes given dataset(xx) and box size (k)
    import numpy as np

    # generate indexes! O(1) way of doing it :)
    idx = np.arange(k)[None, :]+np.arange(len(xx)-k+1)[:, None]
    return xx[idx],idx

def compute_dpcca_others(cdata,k):
    # Input: cdata(nsamples,nvars), k: time scale for dpcca
    # Output: dcca, dpcca, corr, partialCorr
    #
    # Date(last modification): 02/15/2018
    # Author: Jaime Ide ([email protected])

    # Code distributed "as is", in the hope that it will be useful, but WITHOUT ANY WARRANTY;
    # without even the implied warranty of MERCHANTABILITY or FITNESS FOR A PARTICULAR PURPOSE.
    # See the GNU General Public License for more details.

    import numpy as np
    from numpy.matlib import repmat

    # Define
    nsamples,nvars = cdata.shape

    # Cummulative sum after removing mean
    #cdata = signal.detrend(cdata,axis=0) # different from only removing the mean...
    cdata = cdata-cdata.mean(axis=0)
    xx = np.cumsum(cdata,axis=0)

    F2_dfa_x = np.zeros(nvars)
    allxdif = []
    # Get alldif and F2_dfa
    for ivar in range(nvars): # do for all vars
        xx_swin , idx = sliding_window(xx[:,ivar],k)
        nwin = xx_swin.shape[0]
        b1, b0 = np.polyfit(np.arange(k),xx_swin.T,deg=1) # linear fit (UPDATE if needed)

        #x_hat = [[b1[i]*j+b0[i] for j in range(k)] for i in range(nwin)] # Slower version
        x_hatx = repmat(b1,k,1).T*repmat(range(k),nwin,1) + repmat(b0,k,1).T

        # Store differences to the linear fit
        xdif = xx_swin-x_hatx
        allxdif.append(xdif)
        # Eq.4
        F2_dfa_x[ivar] = (xdif**2).mean()
    # Get the DCCA matrix
    dcca = np.zeros([nvars,nvars])
    for i in range(nvars): # do for all vars
        for j in range(nvars): # do for all vars
            # Eq.5 and 6
            F2_dcca = (allxdif[i]*allxdif[j]).mean()
            # Eq.1: DCCA
            dcca[i,j] = F2_dcca / np.sqrt(F2_dfa_x[i] * F2_dfa_x[j])

    # Get DPCCA
    C = np.linalg.inv(dcca)

    # (Clear but slow version)
    #dpcca = np.zeros([nvars,nvars])
    #for i in range(nvars):
    #    for j in range(nvars):
    #        dpcca[i,j] = -C[i,j]/np.sqrt(C[i,i]*C[j,j])

    # DPCCA (oneliner version)
    mydiag = np.sqrt(np.abs(np.diag(C)))
    dpcca = (-C/repmat(mydiag,nvars,1).T)/repmat(mydiag,nvars,1)+2*np.eye(nvars)

    # Include correlation and partial corr just for comparison ;)
    # Compute Corr
    corr = np.corrcoef(cdata.T)
    cov = np.cov(cdata.T)
    # Get parCorr
    C0 = np.linalg.inv(cov)
    mydiag = np.sqrt(np.abs(np.diag(C0)))
    parCorr = (-C0/repmat(mydiag,nvars,1).T)/repmat(mydiag,nvars,1)+2*np.eye(nvars)

#     return corr,parCorr,dcca,dpcca
    return dcca, dpcca
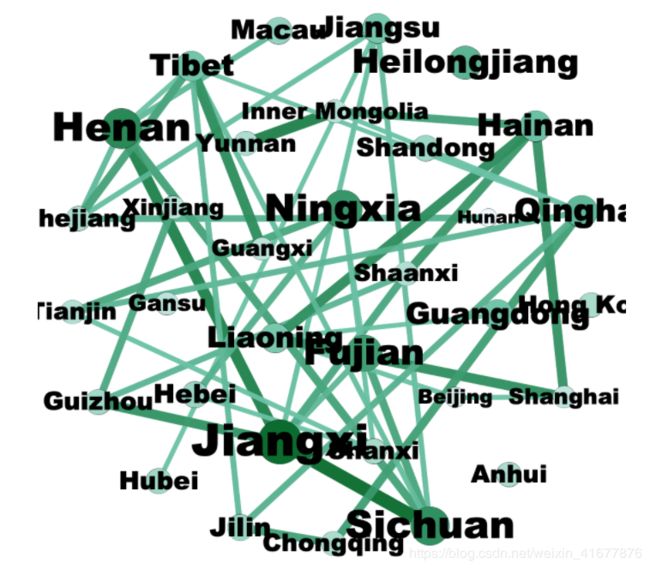
使用Gephi过滤生成中国各省的相关网络
# confirmed_China = confirmed_China.set_index('Province/State')
# confirmed_China = confirmed_China.drop(columns=['Country/Region', 'Lat', 'Long'])
Original_Matrix = pd.DataFrame(columns = confirmed_China.index)
for index, row in confirmed_China.iterrows():
    slope = []
    for i in range(len(row) - 1):
        slope.append(row[i + 1] - row[i])
    for j in range(len(slope) - 1):
        Original_Matrix.loc[j, index] = slope[j + 1] - slope[j]
Original_Matrix = Original_Matrix.values
DCCA, DPCCA = compute_dpcca_others(Original_Matrix, 7)
df_DCCA = pd.DataFrame(data=DCCA, index=confirmed_China.index, columns=confirmed_China.index)
df_DCCA.to_csv('Correlation_DCCA_China.csv')
将CSV文件导入Gephi分析,生成出下面的图片。
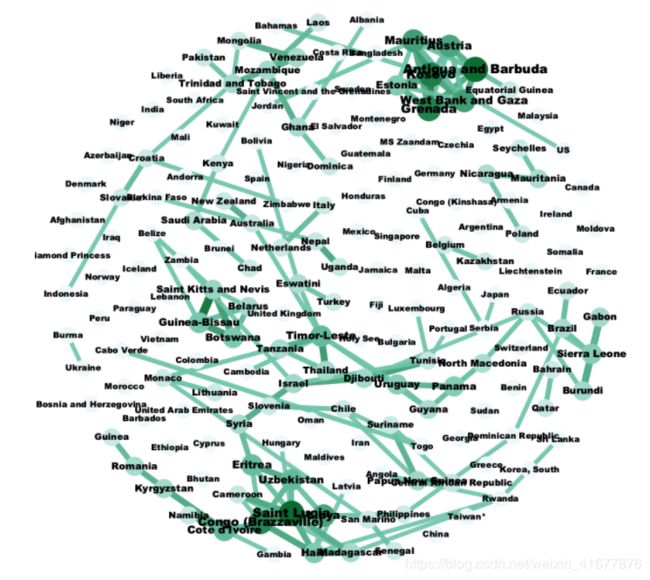
使用Gephi过滤生成全球各国相关网络
Original_Matrix = pd.DataFrame(columns = confirmed_whole.index)
for index, row in confirmed_whole.iterrows():
    slope = []
    for i in range(len(row) - 1):
        slope.append(row[i + 1] - row[i])
    for j in range(len(slope) - 1):
        Original_Matrix.loc[j, index] = slope[j + 1] - slope[j]
Original_Matrix = Original_Matrix.values
DCCA, DPCCA = compute_dpcca_others(Original_Matrix, 7)
df_DCCA = pd.DataFrame(data=DCCA, index=confirmed_whole.index, columns=confirmed_whole.index)
df_DCCA.to_csv('Correlation_DCCA.csv')
使用小波分析寻找COVID19传播的规律
特征提取
A2 = pd.DataFrame(index=confirmed_whole.index, columns=[i for i in range(22)])
D1 = pd.DataFrame(index=confirmed_whole.index, columns=[i for i in range(38)])
D2 = pd.DataFrame(index=confirmed_whole.index, columns=[i for i in range(22)])
Original_Matrix = pd.DataFrame(columns = confirmed_whole.index)
for index, row in confirmed_whole.iterrows():
    slope = []
    for i in range(len(row) - 1):
        slope.append(row[i + 1] - row[i])
    for j in range(len(slope) - 1):
        Original_Matrix.loc[j, index] = slope[j + 1] - slope[j]
for country in Original_Matrix.columns:
    a2, d2, d1 = pywt.wavedec(list(Original_Matrix[country]), 'db4', mode = 'sym', level = 2)
    A2.loc[country] = a2
    D2.loc[country] = d2
    D1.loc[country] = d1
可视化
fig = make_subplots(rows=3, cols=1, vertical_spacing=0.1, specs=[[{"type": "scatter"}], [{"type": "scatter"}], [{"type": "scatter"}]])
for index, item in A2.iterrows():
    fig.add_trace(go.Scatter(y = item, name = item.name, line=dict(width=4)), row=1, col=1)
for index, item in D2.iterrows():
    fig.add_trace(go.Scatter(y = item, name = item.name, line=dict(width=4)), row=2, col=1)
for index, item in D1.iterrows():
    fig.add_trace(go.Scatter(y = item, name = item.name, line=dict(width=4)), row=3, col=1)
fig.update_layout(title='Wavelets', height=600)
py.iplot(fig)
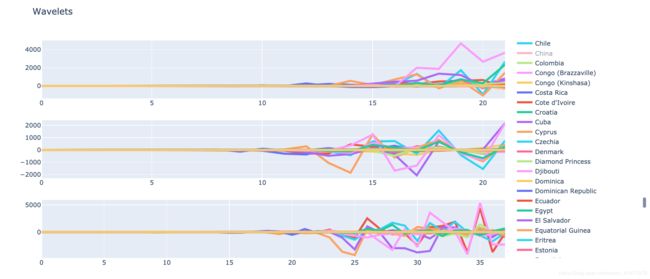
将各国时序分为两个高频段和一个低频段,在第二个高频段A2处,许多国家的序列表现出了类似的特征,对这些频段的分析和提取可以帮助我们为后续进行解释和预测提供非常多的帮助。
说明
本文只供学习使用,后续还会继续更新关于Wavelet分析,复杂网络分析的后续,也打算加入SIR传播模型的分析。如果文中有任何问题,希望大家能够帮忙指出,感谢。
