数字图像处理(绪言)
图像处理基础与MATLAB基础
- 概述
- 什么是数字图像处理
- 数字图像的定义
- 数字图像处理的范围
- 数字图像的表示
- 坐标约定
- 矩阵表示:
- MATLAB与IPT基础
- MATLAB的数据类型:
- IPT支持的图像类型:
- 灰度图像
- 二值图像
- 索引图像
- RGB图像
- 数据类型转换
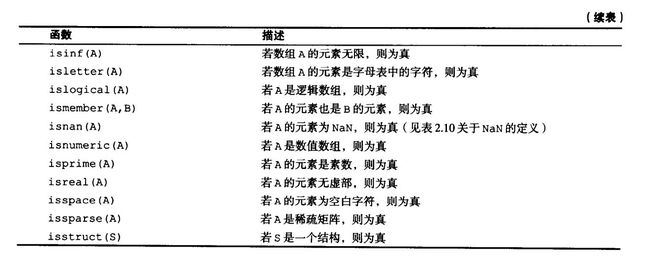
- 判断逻辑类型
- 图像读取
- 函数imread
- 图像显示
- 函数imshow
- 图像保存
- 函数imwrite
- 图像类型转换
- 数组索引
- 向量索引
- 矩阵索引
- 选择数组的维数
- 一些重要的标准数组
- M函数编程
- M文件
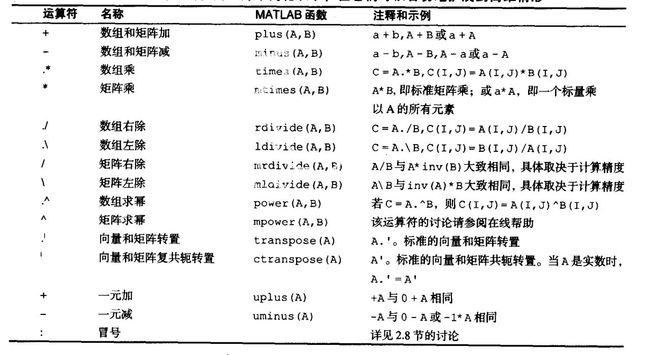
- 运算符
- 流程控制
- 代码优化
- 参考文献
概述
这份笔记是对冈萨雷斯《数字图像处理第三版》的学习整理,编程语言选择MATLAB,笔记中有大量MATLAB中IPT的API介绍
什么是数字图像处理
数字图像的定义
一幅图像可以定义为一个向量值函数 f ( x , y ) f(x,y) f(x,y) , 其中 ( x , y ) (x, y) (x,y) 表示空间坐标(二维空间即为平面), f ( x , y ) f(x, y) f(x,y) 是一个向量,称为像素值,通常是一维或三维。如表示黑白图像时, f(x,y) 是一维的,此时也称为灰度,表示RGB图像时, f(x,y) 是三维,分量分别表示(红,绿,蓝)三个通道的值。
将一幅图像存储到计算机中时,需要对图像数字化,对空间坐标的数字化称为取样,对亮度的数字化称为量化,数字化后的图像仅由有限个离散值表示,称为数字图像。
数字图像处理就是用计算机处理图像。
数字图像处理的范围
图像处理与计算机视觉之间没有明显界限
粗略分类:
- 低级处理:输入输出均为图像。通常是一些原始操作,如:降低噪声的图像预处理,对比度增强和图像锐化
- 中级处理:输入是图像,输出是图像中提取的属性。如图像分割,对象描述,单个对象的分类识别。
- 高级处理:执行与人类视觉相关的感知函数,对识别的对象进行总体确认。
数字图像的表示
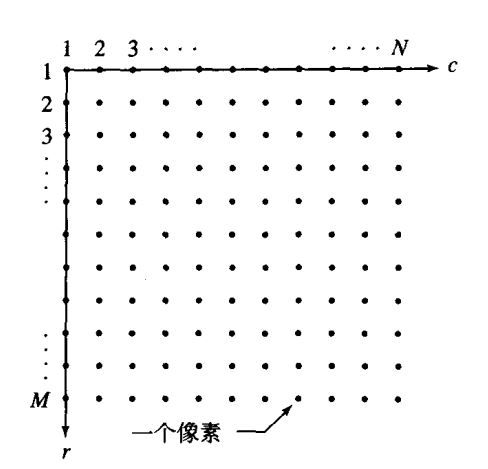
坐标约定
对一幅图像取样后,假设得到 M M M行 N N N列的图像,称图像大小为 M × N M\times N M×N.
通常采用如下两种约定:
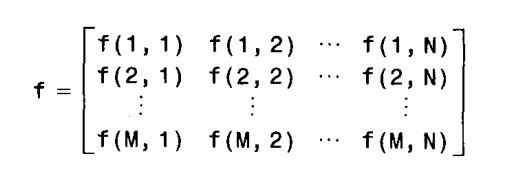
矩阵表示:
MATLAB与IPT基础
MATLAB的数据类型:
| 类型 | 名称 | 描述 |
|---|---|---|
| 数值型 | double | Matlab默认类型,双精度浮点数,- 1 0 308 10^{308} 10308~ 1 0 308 10^{308} 10308 (8字节每像素) |
| 数值型 | uint8 | 无符号8比特整数,[0, 255] (1字节每像素) |
| 数值型 | uint16 | 无符号16比特整数,[0, 65535] (2字节每像素) |
| 数值型 | uint32 | 无符号32比特整数,[0, 4294967295] (4字节每像素) |
| 数值型 | int8 | 有符号8比特整数,[-128, 127] (1字节每像素) |
| 数值型 | int16 | 有符号16比特整数,[-32768, 32767] (2字节每像素) |
| 数值型 | int32 | 有符号32比特整数,[-2147483648, 2147483647] (4字节每像素) |
| 数值型 | single | 单精度浮点数,- 1 0 38 10^{38} 1038~ 1 0 38 10^{38} 1038 (4字节每像素) |
| 字符型 | char | 字符(2字节每像素) |
| 逻辑型 | logical | 值为0或1(1字节每像素) |
IPT支持的图像类型:
灰度图像
一幅灰度图像是一个数据矩阵
像素的数据类型可以是uint8或uint16, 此时取值范围分别是[0,255]或[0, 65535]的整数值
也可以是double, single,此时像素值是浮点数,通常归一化为[0,1], 也可取其他范围值
二值图像
二值图像是取值只有0,1的逻辑数组。取值为0,1的数值型数组在Matlab中不认为是二值图像
索引图像
基本结构
- 整数数据矩阵X
- 彩色映射矩阵map
map是 m × 3 m\times 3 m×3 的矩阵,元素是double类,取值在[0,1]之间,每行代表一个归一化的RGB三原值,m表示颜色总数
X存储颜色索引
如果X是double类,则小于或等于1的所有值对应map的第一行,所有等于2的值对应第二行,以此类推
如果X是uint8,uint16,则0对应第一行,1对应第二行,以此类推
RGB图像
基本结构
M × N × 3 M\times N\times 3 M×N×3 数组
数组每个元素的数据类型:
- double: 取值范围[0,1]
- uint8: 取值范围[0,255]
- uint16: 取值范围[0,65535]
每个像素是一个三维向量[r,g,b],分别表示红,绿,蓝分量
色彩数: ( 2 b ) 3 (2^b)^3 (2b)3 ,b代表数组每个元素的比特数
术语:通常提到一幅图像时,是指 “data_class image_type 图像”。 data_class是MATLAB支持的数据类型,image_type是IPT支持的图像类型
数据类型转换
语法: B = d a t a _ c l a s s _ n a m e ( A ) B = data\_class\_name(A) B=data_class_name(A)
-
data_class_name可以是MATLAB支持的任意一种数据类型,如:
B = d o u b l e ( A ) B = double(A) B=double(A)
会将A转换为double类型B
-
任何数值型转换为逻辑型时,非0值转换为逻辑值1,0值转换为逻辑值0
-
double是MATLAB的默认类型,double转换为整型时,小于该整型取值范围最小值的均转换为最小值,大于该整型取值范围最大值的均转换为最大值,小数部分直接舍去。如:
input:
 a = int8(-129)
 b = int8(3.23)
 c = logical([0 1 2;1 2 3;3.2 0.0 -1])
output
 a =

   int8

    -128
 b =

   int8

    3
 c =

   3×3 logical 数组

    0   1   1
    1   1   1
    1   0   1
判断逻辑类型
语法: i s l o g i c a l ( A ) islogical(A) islogical(A)
- 输入数据A,判断A的类型是否为logical,是则返回1,否则返回0。如:
input:
 a = 7;
 islogical(a)
output:
 ans =

   logical

    0
input:
 a = logical(7);
 islogical(a)
output:
 ans =

   logical

    1
图像读取
函数imread
语法: i m r e a d ( ′ f i l e n a m e ′ ) imread('filename') imread(′filename′)
- filename是图像全名(包含扩展名)的字符串。当filename不含路径信息时,imread会在当前目录中寻找文件,若找不到,则会在MATLAB搜索路径中找。
- 读取指定路径中的图像,可在filename中输入绝对路径或相对路径。如:
input:f = imread('F:\Matlab\chapter1\rose_512.tif'); - imread支持的图像格式:
格式名称 描述 可识别扩展名 TIFF 加表识的图像文件格式 .tif , .tiff JPEG 联合图像专家组 .jpg , .jpeg GIF 图形交换格式 .gif BMP windows位图 .bmp PNG 可移植网络图形 .png XWD X windows 转储 .xwd - 函数size:
输入一个多维数组,返回数组的形状,相当于numpy中数组的shape
input:
output:A = [5 6 7;1 2 3]; A(:,:,2) = [2 3 4; 5 6 7]; size(A)ans = 2 3 2 - 函数whos:
输入一个数组,返回数组的附加信息。
input:
output:f = [1 2 3; 4 5 6; 7 8 9]; whos fName Size Bytes Class Attributes f 3x3 72 double
图像显示
函数imshow
语法一: imshow( f, G)
语法二: imshow(f ,[low , high])
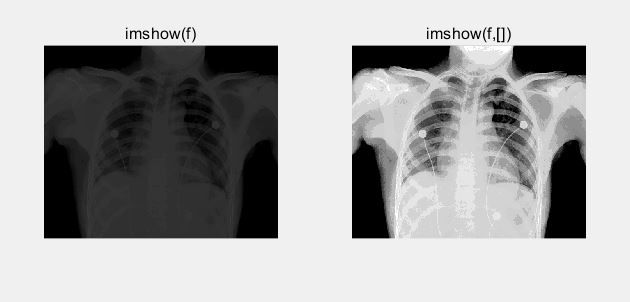
- 将小于等于low的值显示为黑色,大于等于high的值显示为白色,中间像素值按比例显示为各个等级的灰度值
如imshow(f, [0,58]),相当于0-58被线性拉伸到0-255显示
语法三: imshow(f, [ ])
-
这个形式相当于语法二中low取f的最小值,high取f的最大值
-
这个形式在显示一幅动态范围较小的图像或者既有正值又有负值的图像时有优势
input:>> f = imread('D:\typora图片\Fig0203(a)(chest-xray).tif'); >> figure >> subplot(1,2,1);imshow(f),title('imshow(f)'); >> subplot(1,2,2);imshow(f,[]),title('imshow(f,[])'); -
如果f为double型,一定要用这个形式
图像保存
函数imwrite
语法: imwrite(f, ‘filename’)
- filename必须包含可识别的文件格式扩展名,如:
imwrite(f,'picture.tif') imwrite(f,'picture1','tif') - filename如不包含路径信息,则文件保存到当前工作目录
- 只适用于jpg图像:
imwrite(f , ‘filename.jpg’, ‘quality’ , q)-
q是0-100之间的整数,q越小,图像压缩越厉害,图像退化越严重
-
例:
input:>> f = imread('D:\typora图片\Fig0204(a)(bubbles-q-100jpg).tif'); >> imwrite(f,'bubbles50.jpg','quality',50) >> imwrite(f,'bubbles25.jpg','quality',25) >> imwrite(f,'bubbles15.jpg','quality',15) >> imwrite(f,'bubbles5.jpg','quality',5) >> imwrite(f,'bubbles0.jpg','quality',0) >> f100 = imread('bubbles-q-100.tif'); >> f50 = imread('bubbles50.jpg'); >> f25 = imread('bubbles25.jpg'); >> f15 = imread('bubbles15.jpg'); >> f5 = imread('bubbles5.jpg'); >> f0 = imread('bubbles0.jpg'); >> figure >> subplot(2,3,1);imshow(f100),title('原图'); >> subplot(2,3,2);imshow(f50),title('q=50'); >> subplot(2,3,3);imshow(f25),title('q=25'); >> subplot(2,3,4);imshow(f15),title('q=15'); >> subplot(2,3,5);imshow(f5),title('q=5'); >> subplot(2,3,6);imshow(f0),title('q=0');output:

压缩图像是为了降低存储量,减少传输时间,但压缩过大就会失真,通常判断压缩是否合理,就看有没有明显的伪轮廓线。- 使用函数imfinfo保存图像信息
语法一: imfinfo filename- filename是图像全名
- 例:
input:
output:>> imfinfo bubbles25.jpgans = 包含以下字段的 struct: Filename: 'F:\Matlab\chapter1\bubbles25.jpg' FileModDate: '07-Jun-2019 12:50:34' FileSize: 13354 Format: 'jpg' FormatVersion: '' Width: 720 Height: 688 BitDepth: 8 ColorType: 'grayscale' FormatSignature: '' NumberOfSamples: 1 CodingMethod: 'Huffman' CodingProcess: 'Sequential' Comment: {}
- 例:计算压缩比
input:
output:>> K = imfinfo('bubbles25.jpg'); >> image_bytes = K.Width*K.Height*K.BitDepth/8; >> compressed_bytes = K.FileSize; >> compression_ratio = image_bytes/compressed_bytescompression_ratio = 37.0945
- 使用函数imfinfo保存图像信息
-
- 只适用于tif图像:
i m w r i t e ( f , ′ f i l e n a m e . t i f ′ , ′ c o m p r e s s i o n ′ , ′ p a r a m e t e r ′ , . . . , ′ r e s o l u t i o n ′ , [ c o l r e s , r o w r e s ] ) imwrite(f , 'filename.tif' , 'compression' , 'parameter' , ... , 'resolution' , [colres , rowres]) imwrite(f,′filename.tif′,′compression′,′parameter′,...,′resolution′,[colres,rowres])- parameter的主要值:
- none 表示无压缩
- packbits 比特包压缩(非二值图像的默认参数)
- ccitt ccitt压缩(二值图像的默认参数)
- [colres , rowres] 两个整数,默认[72, 72]。分别以每单位像素点的个数(dpi)表示列分辨率与行分辨率。
换成标量res,等价于[res, res] - 例:
以下原图是一块电路板的8比特X光图像,格式jpg,分辨率200dpi,图像大小 450 × 450 450\times 450 450×450 ,尺寸 2.25 × 2.25 2.25\times 2.25 2.25×2.25 英寸。
把这幅图以 tif 格式存为无压缩的名为 sf 的图像,尺寸减到 1.15 × 1.15 1.15\times 1.15 1.15×1.15 英寸,像素数仍保持 450 × 450 450\times 450 450×450>> f = imread('D:\typora图片\2.10.jpg'); >> imwrite(f,'sf.tif','compression','none','resolution',[300,300]) >> g = imread('sf.tif'); >> figure >> subplot(1,2,1);imshow(f),title('原图'); >> subplot(1,2,2);imshow(g),title('sf.tif');
- imwrite支持的图像格式:
格式名称 描述 可识别扩展名 TIFF 加表识的图像文件格式 .tif , .tiff JPEG 联合图像专家组 .jpg , .jpeg XWD X windows 转储 .xwd BMP windows位图 .bmp PNG 可移植网络图形 .png
- parameter的主要值:
图像类型转换
-
im2uint8
语法: g = i m 2 u i n t 8 ( f ) g = im2uint8(f) g=im2uint8(f)- f为输入图像,im2uint8将小于0的值设置为0,大于1的值设置为255,其余值乘以255,若为小数则四舍五入为最接近的整数。
-
im2uint16
同im2uint8,只是255改成65535. -
mat2gray
语法: g = m a t 2 g r a y ( A , [ A m i n , A m a x ] ) g = mat2gray(A, [Amin, Amax]) g=mat2gray(A,[Amin,Amax])- 输出为double类,范围[0,1]
- [Amin, Amax]默认是A中元素实际的最小值与最大值。将小于Amin的值变为0,大于Amax的值变为1,中间值线性伸缩到[0.1]
- 可用于将double类图像归一化
-
im2double
- 将图像转化为double类,范围[0,1],若输入已经是double类,则输出与输入相同。
- 不能对double类图像归一化
-
im2bw
语法: g = i m 2 b w ( f , T ) g = im2bw(f, T) g=im2bw(f,T)- T取值[0,1],默认0.5
- im2bw接收图像f,根据图像类型对f做归一化,然后将小于T的值变为逻辑值0,大于或等于T的值变为逻辑值1,返回一个二值图像
数组索引
向量索引
- MATLAB的索引是从1开始的
- a:b 表示取 [a,b] 之间的整数
- end表示最后一个元素的索引值
- v[:] 产生一个列向量,v[1:end] 产生一个行向量
- a:step:b 表示在[a,b]间依步长step取相应元素
- end:-k:1 表示按步长k的倒序取值
- linspace
语法: x = l i n s p a c e ( a , b , n ) x = linspace(a, b, n) x=linspace(a,b,n)- 产生一个以a为首项,b为末项,项数为n的等差数列构成的向量
- 一个向量可以作为另一个向量的指标向量,如:
 >> v =[2 4 6 8 10 12 14 16];
 >> v([2 4 6])
ans = 4 8 12
矩阵索引
-
每个维度都支持向量索引的方式
-
使用向量做索引值
语法: A[u,v]- A是一个 矩阵,u,v是行向量,返回以u为行标,v为列标的A的子矩阵。
-
使用矩阵寻址的方式
例:用逻辑数组取出逻辑值1位置处的元素,返回一个列向量 -
A ( : ) 以逐列的顺序返回A所有元素构成 的列向量
-
使用数组索引进行简单的图像操作
 >> f = imread('D:\typora图片\Fig0219(rose1024).tif');
 >> fp = f(end:-1:1,:);
 >> fc = f(233:666,233:666);
 >> fs = f(1:2:end,1:2:end);
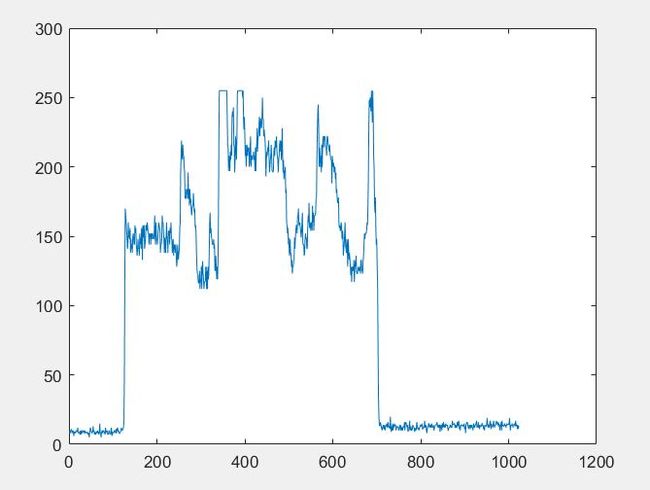
 >> plot(f(512,:))
 >> figure
 >> subplot(1,4,1);imshow(f),title('原图');
 >> subplot(1,4,2);imshow(fp),title('翻转');
 >> subplot(1,4,3);imshow(fc),title('截取部分');
 >> subplot(1,4,4);imshow(fs),title('二次取样');
选择数组的维数
一类操作: o p e r a t i o n ( A , d i m ) operation(A,dim) operation(A,dim)
- operation表示MATLAB的一种可用操作,A是数组,dim是标量
- 例:
- A是 M × N M\times N M×N 的数组
k = size(A,1)给出A的行数,MATLAB中1代表垂直方向,2代表水平方向。
- A是 M × N M\times N M×N 的数组
- ndims
语法: d = ndims(A)- 类似于numpy的维度,但MATLAB中ndims不小于2
 >> A = 1;
 >> B = [2 2];
 >> C = [2 3;3 4];
 >> D(:,:,1) = [2 3 ;4 5];
 >> D(:,:,2) = [6 7;8 9];
 >> ndims(A),ndims(B),ndims(C),ndims(D)
ans = 2 ans = 2 ans = 2 ans = 3
- 类似于numpy的维度,但MATLAB中ndims不小于2
一些重要的标准数组
- zeros(M,N) 生成一个大小为 M × N M\times N M×N 的double类矩阵,元素全为0
- ones(M,N) 生成一个大小为 M × N M\times N M×N的double类矩阵,元素全为1
- ture(M,N) 生成一个大小为 M × N M\times N M×N 的logical类矩阵,元素全为逻辑值1
- false(M,N) 生成一个大小为 M × N M\times N M×N 的logical类矩阵,元素全为逻辑值0
- magic(M) 生成一个大小为 M × M M\times M M×M的 ”魔术方阵“,每行每列两条主对角线元素之和相等,元素均为整数。
- rand(M,N) 生成一个大小为 M × N M\times N M×N 的矩阵,元素是[0,1]中均匀分布的随机数
- randn(M,N) 生成一个大小为 M × N M\times N M×N 的矩阵,元素是服从标准正态分布的随机数
M函数编程
M文件
- 功能:可以是执行一列MATLB语句的脚本,也可以是函数
- 文件格式:filename.m
- 组成部分:
- 函数定义行
function [outputs] = name(inputs) - H1行
- 帮助文本
- 函数体
- 命令
- 函数定义行
运算符
-
- 注意:MATLAB不复制信息
例:>> A = [1 2 3]; >> B = A; >> A = [1 2 4]; >> B
第二行命令只是记录了B=A,并不把数据复制给B,但第三行A要改变时,才将数据复制给BB = 1 2 3
- 注意:MATLAB不复制信息
-
IPT支持的图像运算函数
-
- 数组之间比较,必须形状相同,相同位置的元素进行比较
- 数组与标量比较,是数组的每个元素分别和标量比较
-
- 数组之间进行逻辑运算,必须形状相同,相同位置的元素进行逻辑运算
- 数组与标量做逻辑运算,是数组的每个元素分别和标量做逻辑运算
-
逻辑函数
-
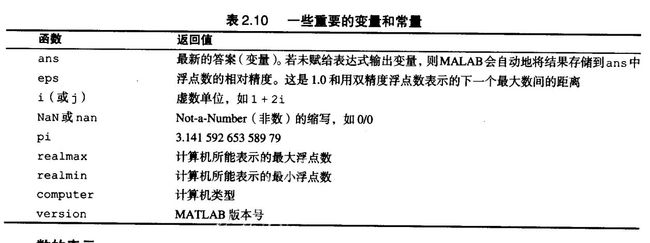
- eps经常用于加在分母中,防止因分母接近0而使计算溢出
流程控制
-
条件分支
通用形式语法:if expression1 statements1 elseif expression2 statements2 ... else expressionk statementsk end例:计算图像的平均亮度
function ave = average(A) %AVERAGE computes the average value of an array % av=average(A) computes the average value of input array,A, which must be % 1-D or 2-D array % check the validity of input if ndims(A) > 2 error('The dimension of input can not exceed 2!') end %compute the average ave = sum(A(:))/length(A(:));- 函数numel可以统计数组的元素个数
-
for 循环
语法:for index = start:step:endpoint statements end- 可以嵌套
-
while循环
语法:while expresssion statements end -
break
退出包含它的最内层循环 -
continue
直接进入包含它的循环的下一次迭代 -
switch
switch switch_expresssion case case_expression1 statement(s) case case_expression2 statement(s) ... otherwise statement(s) end- 例:从给定图片中提取子图像
 function s = subim(f,m,n,rx,cy)
 %SUBIM extracts a subimage s from a given image f
 % The subimage is of size m_by_n, and the coordinates of its top_left
 % conner are (rx,cy)

 s = zeros(m,n);
 rowhigh = rx + m - 1;
 colhigh = cy + n - 1;
 xcount = 0;
 for r = rx:rowhigh
     xcount = xcount + 1;
     ycount = 0;
     for c = cy:colhigh
         ycount = ycount + 1;
         s(rcount, ycount) = f(r,c);
     end
 end
- 例:从给定图片中提取子图像
代码优化
-
向量化循环
-
原理:利用矩阵运算避免显式地使用循环
-
例:生成一个一维函数,函数形式是:
f ( x ) = A s i n ( x / 2 π ) f(x)=Asin(x/2\pi) f(x)=Asin(x/2π)
其中 x = 0 , 1 , . . . , M − 1 x=0,1,...,M-1 x=0,1,...,M−1- for循环
for x = 1:M f(x) = A*sin(x/(2*pi)); end - 向量化
 x = 1:M;
 f(x) = A*sin(x/(2*pi));
- for循环
-
二维函数情形
meshgrid
语法: [C,R] = meshgrid(c,r)- 输入c,r是行向量,输出数组C的行是向量c的副本,输出数组R的列是向量r的副本
- 例:
input:
output:>> r = [0 1 2]; >> c = [0 1]; >> [C,R] = meshgrid(c,r), h = R.^2+C.^2C = 0 1 0 1 0 1 R = 0 0 1 1 2 2 h = 0 1 1 2 4 5- h ( i , j ) = R ( i , j ) 2 + C ( i , j ) 2 h(i,j)=R(i,j)^2+C(i,j)^2 h(i,j)=R(i,j)2+C(i,j)2
- 注意:MATLAB的索引不能是0
-
例:比较两种方式的计算速度
编写一个M文件,比较for循环与向量化代码的运算速度,所实现的二维函数:
f ( x , y ) = A s i n ( u 0 x + v 0 y ) f(x,y)=Asin(u_0 x+v_0 y) f(x,y)=Asin(u0x+v0y)
x = 0 , 1 , . . . , M − 1 , y = 0 , 1 , . . . , N − 1 x=0,1,...,M-1 , y=0,1,...,N-1 x=0,1,...,M−1,y=0,1,...,N−1
函数输入: A , u 0 , v 0 , M , N A,u_0,v_0,M,N A,u0,v0,M,N
函数输出:由两种方式生成的图像,以及所用时间之比function [tratio, f, g] = two_method_sin(A, u0, v0, M, N) %TWO_METHOD_SIN Compares for loops vs. vectorization % The comparison is based on implementing the function % f(x,y)=Asin(u0*x+v0*y) for x=0,1,...,M-1 and y=0,1,...N-1 % The inputs to the function are M and N and the constants in the % function % first implement using for loops tic % start timing for r = 1:M u0x = u0*(r-1); for c = 1:N v0y = v0*(c-1); f(r,c) = A*sin(u0x + v0y); end end t1 = toc; % end timing % now implement using vectorization tic % start timing r = 0:M-1; c = 0:N-1; [C,R] = meshgrid(c,r); g = A*sin(u0*R + v0*C); t2 = toc; % end timing % compute the ratio of the two times tratio = t1/(t2 + eps); % use eps in case t2 is close to 0>> [rt,f,g] = two_method_sin(1, 1/(4*pi), 1/(4*pi), 512, 512); >> rt rt = 10.9560 -
提取图片中某一矩形区域
区域左上角坐标为 ( r x , r y ) (rx,ry) (rx,ry) , 大小为 m × n m\times n m×n , f 是将要提取的图像。rowhigh = rx + m - 1; colhigh = ry + n - 1; s = f(rx:rowhigh, ry:colhigh);
-
-
预分配数组
- 例:为了处理 1024 × 1024 1024\times 1024 1024×1024 的图像,先预分配一个全为0的数组
>> f = zeros(1024); - 原理:处理大数组时,有时会出现没有足够的连续空间的情形,预分配数组阻止了这一情形
- 例:为了处理 1024 × 1024 1024\times 1024 1024×1024 的图像,先预分配一个全为0的数组
交互式I/O
- disp
语法: disp(argument)- argument是数组时,显示数组
- argument是字符串时,显示字符串
例:>> A = [1 2 3] A = 1 2 3 >> disp(A) 1 2 3 >> disp('Hello MATLAB!') Hello MATLAB!
- input
语法: t = input(‘message’ , ‘s’)- 用于将数据传入M函数
- 输出message的内容,接收一个字符串,字符串的内容可以由逗号或空格隔开
例:>> t = input('enter some data:','s') enter some data:1 2 3 t = '1 2 3' >> class t ans = 'char' >> size(t) ans = 1 5 >> n = str2num(t) n = 1 2 3 >> size(n) ans = 1 3 >> class(n) ans = 'double'
- strread
语法: [a,b,c,…] = strread(cstr , ‘format’ , ‘param’ , ‘value’)- 用于处理既有字符串,又有数字的输入
- format指定格式,如%f表示浮点数,%q表示字符串
- param 通常是delimiter
- value 通常是空格或逗号
例:>> t = '2.3,hello,x'; >> [a,b,c] = strread(t,'%f%q%q','delimiter',','); >> a,b,c a = 2.3000 b = 1×1 cell 数组 {'hello'} c = 1×1 cell 数组 {'x'} - strcmp比较字符串是否相同
- lower/upper 将字符串改成小写/大写
单元数组与结构
-
单元数组
- 相当于将不同类型的对象组合在一起的容器
- 例:
input:
output:>> c = {'gauss',[1.0 3.0],3},c{1}c = 1×3 cell 数组 {'gauss'} {1×2 double} {[3]} ans = 'gauss' - 它包含的是参量的副本,参量在后续程序中改变,单元数组不变
-
结构
- 有点类似于C++中的结构体
- 例:
input:
output:>> S.char_str = 'gauss'; >> S.matrix = [1.0 3.0]; >> S.scalar = 3; >> S.matrixans = 1 3
参考文献
《数字图像处理第三版》(冈萨雷斯)
《数字图像处理(matlab)》

