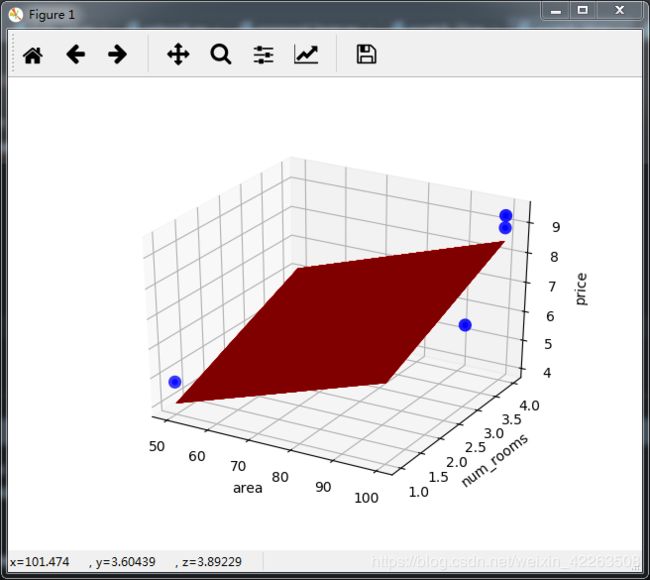
多维线性回归sklearn实现
多维线性回归sklearn实现
#coding:utf-8
from mpl_toolkits.mplot3d import Axes3D
import numpy as np
from matplotlib import pyplot as plt
from sklearn.linear_model import LinearRegression

x_data = np.array(
	[[100,4],
 	[50, 1],
	[100,4],
 	[100,3],
 	[50, 2],
    [80, 2],
 	[75, 3],
	[65, 4],
 	[90, 3],
 	[90, 2]])
#房屋价格(单位百万)
y_data = np.array([9.3, 4.8, 8.9, 6.5, 4.2, 6.2, 7.4, 6.0, 7.6,6.1])
print(x_data)
print(y_data)


#建立模型
model = LinearRegression()
#开始训练
model.fit(x_data,y_data)

#结果显示
    #斜率
print("coefficients: ",model.coef_)
w1 = model.coef_[0]
w2 = model.coef_[1]

 #截距
print("intercept: ",model.intercept_)
b = model.intercept_

	#测试
x_test = np.array([[90,3]])#只有变成数组后面才可以使用scatter,如果是x_test=[[90,3]],可以计算predict,但是没法画该点的散点图
predict = model.predict(x_test)
print("predict: ",predict)

#绘图"
ax = plt.figure().add_subplot(111,projection = '3d')
# ax = plt.figure().gca(projection = '3d')
ax.scatter(x_data[:, 0], x_data[:,1],y_data, c ="b",marker="o",linewidths=5)
x0 = x_data[:,0]
print(x_data[:, 0])
x1 = x_data[:,1]

x0 ,x1 = np.meshgrid(x0,x1)
z = b + w1 * x0 + w2 * x1
ax.plot_surface(x0, x1, z,color = "r")
ax.set_xlabel('area')
ax.set_ylabel('num_rooms')
ax.set_zlabel('price')
print(x_test[0])
print(x_test[:,0])
# ax.scatter(x_test[:,0],x_test[:,1],b + w1 * x_test[:,0] + w2 * x_test[:,1],color = "r",linewidths=10)
ax.scatter(x_test[0][0],x_test[0][1],b + w1 * x_test[0][0] + w2 * x_test[0][1],color = "r",linewidths=10)

plt.show()
coefficients:  [ 0.04701969  0.68363883]
intercept:  1.02423625255
predict:  [ 7.30692464]
注意:
- 线性sklearn实现的结构
from mpl_toolkits.mplot3d import Axes3D
import numpy as np
from matplotlib import pyplot as plt
from sklearn.linear_model import LinearRegression
x_data = np.array(
[[100,4],
[50, 1]])
#房屋价格(单位百万)
y_data = np.array([9.3, 4.8, 8.9, 6.5, 4.2, 6.2, 7.4, 6.0, 7.6,6.1])
#建立模型
model = LinearRegression()
#开始训练
model.fit(x_data,y_data)
w1 = model.coef_[0]
w2 = model.coef_[1]
b = model.intercept_ - 输入的数据格式: x_data是一维线性是一维数组/多维线性是多维数组
y_data都是一维数组
参考:
https://blog.csdn.net/alionsss/article/details/86820485
