Python一:【skimage】图像处理库的应用,不使用opencv的情况
python作为简单高效又很强大的一门编程语言,scikit-image是python中处理图像的一个库,对大多数的图像处理算法进行了封装,用户只需调用相关的接口即可实现想要的效果。
所以,本章节主要讲解以下内容:
1
scikit image 安装使用
2
scikit image 模块介绍
3
scikit image 基本操作
4
scikit image 图像增强
5
scikit image 图像分割
目录
一、scikit-image 安装使用
二、skimage库子模块介绍
调用
子模块名称
主要实现功能
io
data
color
filters
draw
transform
morphology
exposure
feature
measure
segmentation
restoration
util
三、scikit image 基本操作
1.读取及显示
2.保存
3.图片信息显示
四、scikit image 图像增强
1.灰度变换
2.直方图均衡化
3.平滑滤波器
4.锐化滤波器
五、scikit image 图像分割
1.阈值分割
2.形态学变换
一、scikit-image 安装使用
scikit-image是基于scipy的一款图像处理包,它将图片作为numpy数组进行处理,正好与matlab一样,因此,我们最终选择scikit-image进行数字图像处理。
python库的安装,可以通过pip进行安装
sudo pip install xxxxscikit-image是基于numpy,因此需要安装numpy和scipy,同时需要安装matplotlib进行图片的实现等。
因此,需要安装如下的包:
numpy (1.13.3)
matplotlib (2.1.0)
scikit-image (0.13.1)
scipy (1.0.0)
也可以直接下载集成开发环境Anaconda,【https://www.anaconda.com/download/】
该环境已经集成了数字图像处理相关的包,因此安装起来比较方便。
可以通过如下程序简单测试下相关库是否安装成功:
import numpy as np
import scipy as sp
import matplotlib.pyplot as plt
from skimage import io

img = io.imread("./cat.png")
print(img.shape)

plt.imshow(img)
plt.show()
若显示正常,则可以认为相关的库安装成功!
二、skimage库子模块介绍
skimage库的全称scikit-image
Scikit, 是对scipy.ndimage进行了扩展,提供了更多的图片处理功能。skimage包含很多的子模块,各个子模块具有不同的功能,如下:【点击相应“子模块名称”,会跳转到详细的参考手册说明。】
skimage的子模块
调用 |
子模块名称 |
主要实现功能 |
| from skimage import io img=io.imread('图片路径',as_grey = bool值) io.imshow(img) io.imsave('保存路径',img) |
io |
读取、保存和显示图片或视频 |
| from skimage import data |
data |
提供一些测试图片和样本数据 |
| from skimage import color |
color |
颜色空间变换 |
| from skimage import filters img = io.imread("D:/1.jpg")# 图片路径 thresh = filters.threshold_otsu(img) #用otsu算法确定最佳分割阈值 |
filters |
图像增强、边缘检测、排序滤波器、自动阈值等 |
| from skimage import draw | draw |
操作于numpy数组上的基本图形绘制,包括线条、矩形、圆和文本等 |
| from skimage import transform import matplotlib.pyplot as plt#用于显示图像 img=io.imread("D:/1.jpg")# 图片路径dst=transform.resize(img, (长, 宽)) |
transform |
几何变换或其它变换,如旋转、拉伸和拉东变换等 |
| from skimage import morphology img1 = morphology.remove_small_objects(ar, min_size=要删除的连通域大小阈值, connectivity=1,in_place=False) |
morphology |
形态学操作,如开闭运算、骨架提取等 |
| from skimage import exposure | exposure |
图片强度调整,如亮度调整、直方图均衡等 |
| from skimage import feature | feature |
特征检测与提取等 |
| from skimage import measure labels = measure.label(二值图像,connectivity=None) |
measure |
图像属性的测量,如相似性或等高线等 |
| from skimage import segmentation | segmentation |
图像分割 |
| from skimage import restoration |
restoration |
图像恢复 |
| from skimage import util | util |
通用函数 |
skimage的主要步骤:
#以下简要记录skimage的主要步骤……
- numpy as np: #histogram公开数据,output format可任意
- threshold adaptive:#threshold (neighborhood of a pixel)
- peak_local_max: #maxima
- regionprops: #label image regions,eg:(fx,fy),S,L……
三、scikit image 基本操作
1.读取及显示
from skimage import io
picture = io.imread("D:/1.jpg")# 图片路径
io.imshow(picture)
2.保存
使用 io.imsave(fname, arr) 函数进行保存,
参数fname: 表示保存的路径和名称
- 参数arr:表示需要保存的数组变量
"""
保存图片,格式自由选择,之前jpg现在存为tif格式
"""
io.imsave('D:/1.tif',picture)
3.图片信息显示
from skimage import io, data

img = data.chelsea()
io.imshow(img)
io.show()

"""
打印图片信息
"""

print(type(img))    # 类型
print(img.shape)    # 形状
print(img.shape[0]) # 图片宽度
print(img.shape[1]) # 图片高度
print(img.shape[2]) # 图片通道数
print(img.size)     # 显示总像素个数
print(img.max())    # 最大像素值
print(img.min())    # 最小像素值
print(img.mean()) # 像素平均值![]()
四、scikit image 图像增强
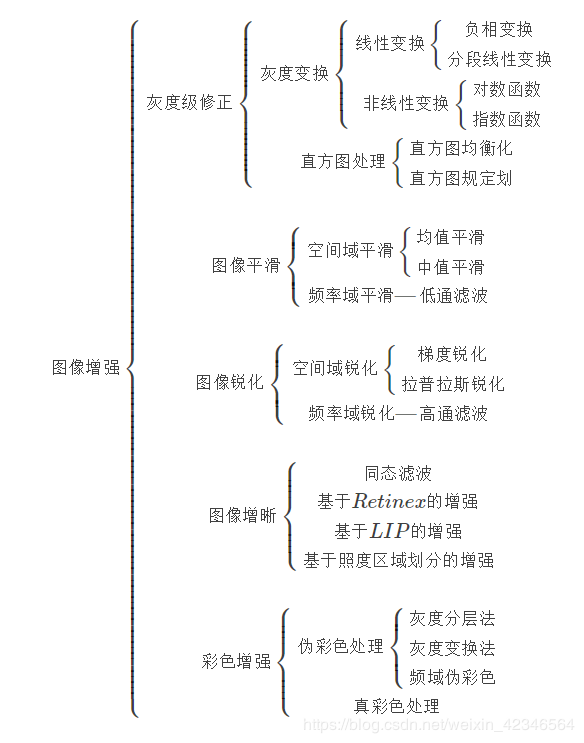
常用的图像增强方法 :
(1) 直方图均衡化 有些图像在低值灰度区间上频率较大,使得图像中较暗区域中的细节看不清楚。这时可以通过直方图均衡化将图像的灰度范围分开,并且让灰度频率较小的灰度级变大,通过调整图像灰度值的动态范围,自动地增加整个图像的对比度,使图像具有较大的反差,细节清晰。
(2) 对比度增强法 有些图像的对比度比较低,从而使整个图像模糊不清。这时可以按一定的规则修改原来图像的每一个象素的灰度,从而改变图像灰度的动态范围。
(3) 平滑噪声 有些图像是通过扫描仪扫描输入、或传输通道传输过来的。图像中往往包含有各种各样的噪声。这些噪声一般是随机产生的,因此具有分布和大小不规则性的特点。这些噪声的存在直接影响着后续的处理过程,使图像失真。图像平滑就是针对图像噪声的操作,其主要作用是为了消除噪声,图像平滑的常用方法是采用均值滤波或中值滤波,均值滤波是一种线性空间滤波,它用一个有奇数点的掩模在图像上滑动,将掩模中心对应像素点的灰度值用掩模内所有像素点灰度的平 均值代替,如果规定了在取均值过程中掩模内各像素点所占的权重,即各像素点所乘系数,这时就称为加权均值滤波;中值滤波是一种非线性空间滤波,其与均值滤波的区别是掩模中心对应像素点的灰度值用掩模内所有像素点灰度值的中间值代替。
(4) 锐化 平滑噪声时经常会使图像的边缘变的模糊,针对平均和积分运算使图像模糊,可对其进行反运算采取微分算子使用模板和统计差值的方法,使图像增强锐化。图像边缘与高频分量相对应,高通滤波器可以让高频分量畅通无阻,而对低频分量则充分限制,通过高通滤波器去除低频分量,也可以达到图像锐化的目的。
- NumPy 官网 :http://www.numpy.org/
- NumPy 源代码:https://github.com/numpy/numpy
- SciPy 官网:https://www.scipy.org/
- SciPy 源代码:https://github.com/scipy/scipy
- Matplotlib 官网:https://matplotlib.org/
- Matplotlib 源代码:https://github.com/matplotlib/matplotlib
以下分类介绍了图像增强的所有方法,详述,请见:https://wenku.baidu.com/view/3b617a1ac5da50e2524d7f3e.html
作为图像处理的一个部分,图像增强用来改善图像的图像的质量,也就是让图片更好看。
1.灰度变换
改变图片的对比度和亮度。常见的算法有:【参考:https://blog.csdn.net/guanzhen3657/article/details/81138868】
- 伽马 校正:伽马变换主要用于图像的校正,将灰度过高或者灰度过低的图片进行修正,增强对比度。伽马变换对图像的修正作用其实就是通过增强低灰度或高灰度的细节实现的。
- log对数 调整:对数图像增强是图像增强的一种常见方法,其公式为: S = c log(r+1),其中c是常数(以下算法c=255/(log(256)),这样可以实现整个画面的亮度增大。
- 指数图像增强:表达为:S = cR^r,通过合理的选择c和r可以压缩灰度范围,算法以c=1.0/255.0, r=2实现。
具体来说就是将灰度过高或者灰度过低的图片进行修正,增强对比度。变换公式就是对原图像上每一个像素值做乘积运算。
- γ>1 时,对图像的灰度分布直方图具有拉伸作用(使灰度向高灰度值延展)
- γ<1时,对图像的灰度分布直方图具有收缩作用(是使灰度向低灰度值方向靠拢)
这里使用到matplotlib包,这是python中的一个绘图工具,用来展示图像,绘制统计图的。
# -*- coding: utf-8 -*-
"""
Spyder Editor

This is a temporary script file.
"""
from skimage import data
from skimage import exposure, img_as_float
import matplotlib.pyplot as plt

# 把图像的像素值转换为浮点数
imge5 = img_as_float(data.coffee())

# 使用伽马调整
# 第二个参数控制亮度,大于1增强亮度,小于1降低。
gam1 = exposure.adjust_gamma(imge5, 2)


# 对数调整
log1 = exposure.adjust_log(imge5, 0.7)


# 用一行两列来展示图像
plt.subplot(1, 3, 1)
plt.imshow(imge5, plt.cm.gray)

plt.subplot(1, 3, 2)
plt.imshow(gam1, plt.cm.gray)

plt.subplot(1, 3, 3)
plt.imshow(log1, plt.cm.gray)
2.直方图均衡化
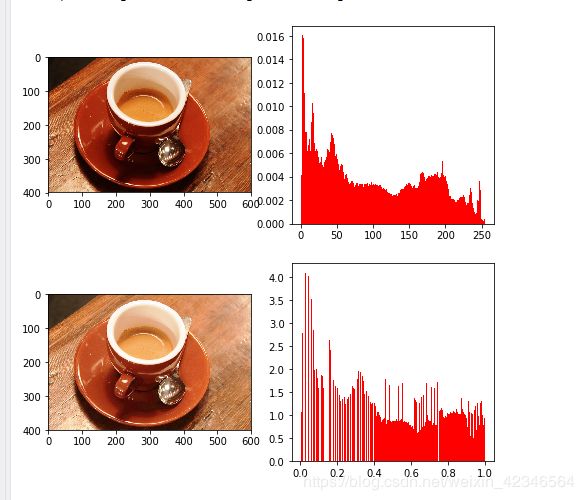
直方图均衡化,能有效的改善图像。直方图均衡化简单来说就是通过将直方图变为均匀分布的来改善对比度。直方图的横坐标代表某个像素,纵坐标代表该像素有多少个。
直方图均衡化是图像处理领域中利用图像直方图对对比度进行调整的方法。
这种方法通常用来增加许多图像的局部对比度。这种方法对于背景和前景都太亮或者太暗的图像非常有用,这种方法尤其是可以带来X光图像中更好的骨骼结构显示以及曝光过度或者曝光不足照片中更好的细节。这种方法的一个主要优势是它是一个相当直观的技术并且是可逆操作。
# -*- coding: utf-8 -*-
"""
Spyder Editor

This is a temporary script file.
"""
from skimage import data
import matplotlib.pyplot as plt

# 直方图均衡化

img6 = data.coffee()
# 指定绘制的大小
plt.figure("hist", figsize=(8, 8))

# 把图像的二维数组按行转为一维数组,这样才能绘制直方图
arr = img6.flatten()

plt.subplot(2,2,1)
plt.imshow(img6, plt.cm.gray)
plt.subplot(2,2,2)
# 绘制直方图
plt.hist(arr, bins=256, normed=1, edgecolor='None',facecolor='red')

# 对直方图进行均衡化
img_c = exposure.equalize_hist(img6)
arr_c = img_c.flatten()
plt.subplot(2,2,3)
plt.imshow(img_c, plt.cm.gray)
plt.subplot(2,2,4)
plt.hist(arr_c, bins=256, normed=1, edgecolor='None', facecolor='red')

plt.show()
可以明显的看出,经过直方图均衡化之后,图像质量改善了许多。
3.平滑滤波器
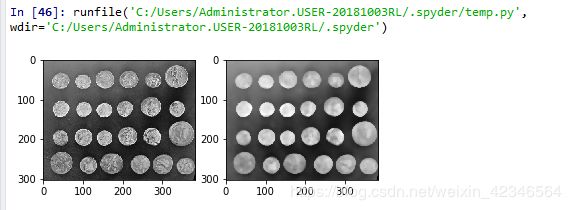
平滑滤波器可以用来去除噪声和平滑化处理图像,具体使用到的滤波器为:
- 低通滤波
- 中值滤波
滤波器相关的算法放在filter模块下,需要导入。
# -*- coding: utf-8 -*-
"""
Spyder Editor

This is a temporary script file.
"""
from skimage import filters
from skimage import data
import skimage.morphology as sm
import matplotlib.pyplot as plt

image6 = data.coins()
# 中值滤波
# 第二个参数代表滤波器的形状,disk代表平面圆形,当然还有什么正方形,矩形啥的
edges = filters.median(image6, sm.disk(5))

plt.subplot(1, 2, 1)
plt.imshow(image6, plt.cm.gray)

plt.subplot(1, 2, 2)
plt.imshow(edges, plt.cm.gray)注意:这里的图片只能使用 (2-D)二维图!!
4.锐化滤波器
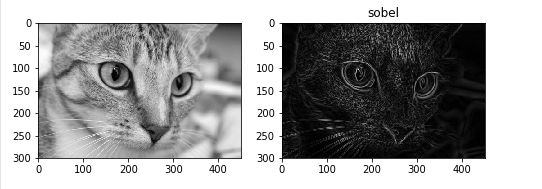
与平滑滤波器正好相反,锐化滤波器可以用来提取边缘,凸显某些标志,突出细节等。其中的算法包括各种算子:
- sobel 算子:
- roberts算子:
- prewitt 算子:
- laplace算子:使用中心为5的8邻域拉普拉斯算子与图像卷积可以达到锐化增强图像的目的。
- canny 算子:
- ...
比如使用sobel描述图像中物体的边缘。
# -*- coding: utf-8 -*-
"""
Spyder Editor

This is a temporary script file.
"""
from skimage import filters
from skimage import data
import skimage.morphology as sm
import matplotlib.pyplot as plt

img = color.rgb2gray(data.chelsea())
# 使用sobel算子
edges = filters.sobel(img)

plt.figure("img", figsize=(8,8))
plt.subplot(1,2,1)
plt.imshow(img, plt.cm.gray)
plt.subplot(1,2,2)
plt.title("sobel")
plt.imshow(edges, plt.cm.gray)
plt.show()
五、scikit image 图像分割
图像分割主要就是进行特征提取,从而识别图像中的物体。这里主要介绍:
- 阈值分割
- 形态学变换
1.阈值分割
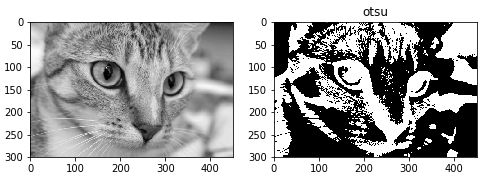
阈值分割就是利用图像中要提取的目标区域与其背景在灰度特性上的差异,把图像看作具有不同灰度级的两类区域(目标区域和背景区域)的组合,选取一个比较合理的阈值,产生二值图像。
# -*- coding: utf-8 -*-
"""
Spyder Editor

This is a temporary script file.
"""
from skimage import filters
from skimage import data
from skimage import color
import matplotlib.pyplot as plt

img = color.rgb2gray(data.chelsea())
# 基于otsu阀值分割方法
thresh = filters.threshold_otsu(img)
dst = (img<=thresh)*1.0

plt.figure("img", figsize=(8,8))
plt.subplot(1,2,1)
plt.imshow(img, plt.cm.gray)
plt.subplot(1,2,2)
plt.title("otsu")
plt.imshow(dst, plt.cm.gray)
plt.show()
2.形态学变换
# -*- coding: utf-8 -*-
"""
Spyder Editor

This is a temporary script file.
"""
from skimage import filters
from skimage import data
from skimage import color
import skimage.morphology as sm
import matplotlib.pyplot as plt

#img = data.checkerboard()
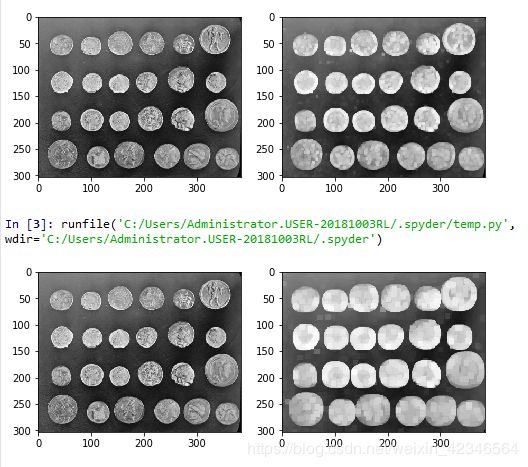
img=data.coins()

#dst = sm.dilation(img, sm.square(5))
dst = sm.dilation(img, sm.square(10))

plt.figure('dilation', figsize=(8,8))
plt.subplot(1,2,1)
plt.imshow(img, plt.cm.gray)
plt.subplot(1,2,2)
plt.imshow(dst, plt.cm.gray)以下是squre()分别为5 和 10 的形态学处理结果:

