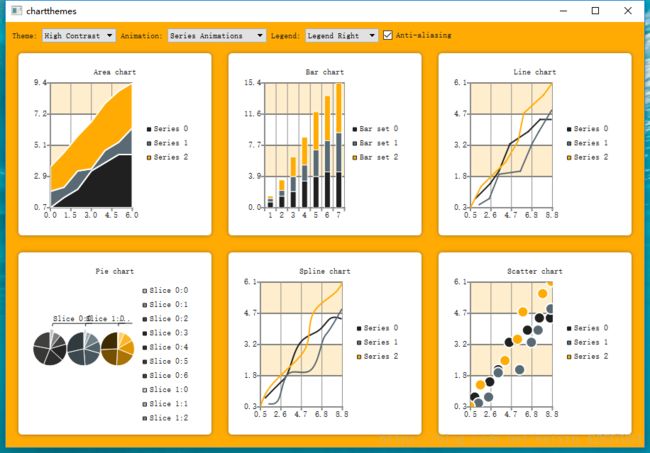
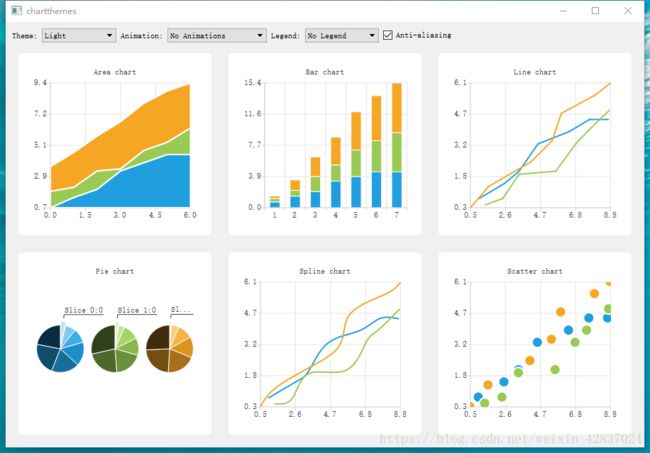
QChart 各种样式 酷炫 多图 源码(Qt 自带的demo)
#Qt 自带的demo
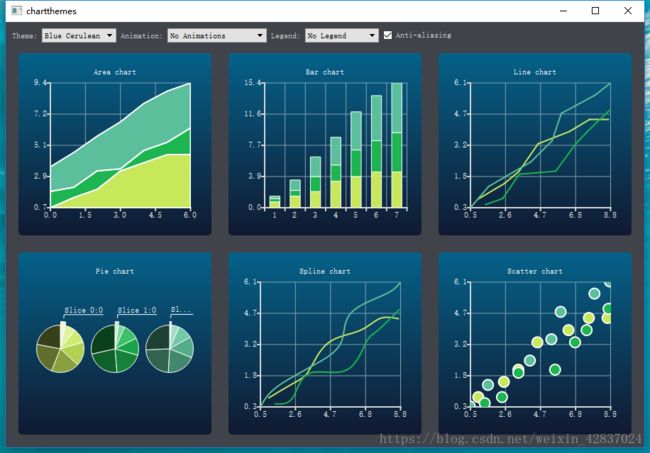
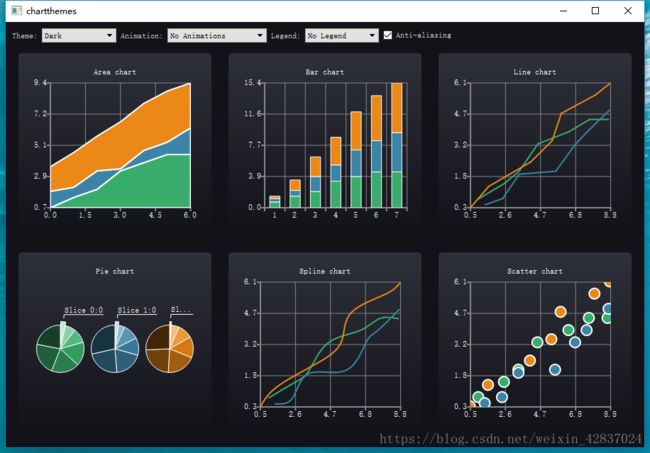
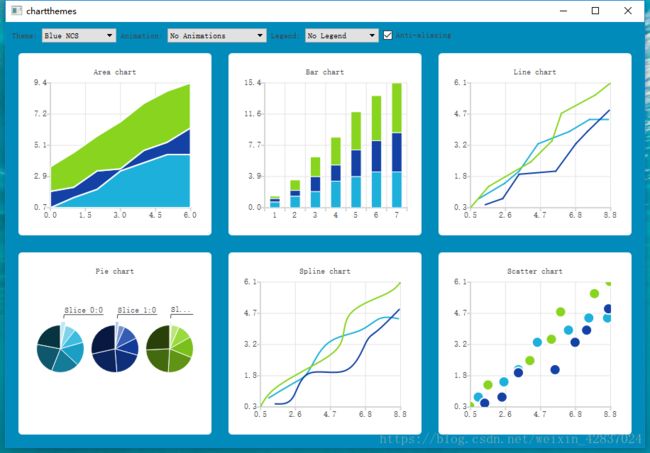
Chart Themes Example 直接上图片

themewidget.h
/****************************************************************************
**
** Copyright (C) 2016 The Qt Company Ltd.
** Contact: https://www.qt.io/licensing/
**
** This file is part of the Qt Charts module of the Qt Toolkit.
**
** $QT_BEGIN_LICENSE:GPL$
** Commercial License Usage
** Licensees holding valid commercial Qt licenses may use this file in
** accordance with the commercial license agreement provided with the
** Software or, alternatively, in accordance with the terms contained in
** a written agreement between you and The Qt Company. For licensing terms
** and conditions see https://www.qt.io/terms-conditions. For further
** information use the contact form at https://www.qt.io/contact-us.
**
** GNU General Public License Usage
** Alternatively, this file may be used under the terms of the GNU
** General Public License version 3 or (at your option) any later version
** approved by the KDE Free Qt Foundation. The licenses are as published by
** the Free Software Foundation and appearing in the file LICENSE.GPL3
** included in the packaging of this file. Please review the following
** information to ensure the GNU General Public License requirements will
** be met: https://www.gnu.org/licenses/gpl-3.0.html.
**
** $QT_END_LICENSE$
**
****************************************************************************/
#ifndef THEMEWIDGET_H
#define THEMEWIDGET_H
#include themewidget.cpp
/****************************************************************************
**
** Copyright (C) 2016 The Qt Company Ltd.
** Contact: https://www.qt.io/licensing/
**
** This file is part of the Qt Charts module of the Qt Toolkit.
**
** $QT_BEGIN_LICENSE:GPL$
** Commercial License Usage
** Licensees holding valid commercial Qt licenses may use this file in
** accordance with the commercial license agreement provided with the
** Software or, alternatively, in accordance with the terms contained in
** a written agreement between you and The Qt Company. For licensing terms
** and conditions see https://www.qt.io/terms-conditions. For further
** information use the contact form at https://www.qt.io/contact-us.
**
** GNU General Public License Usage
** Alternatively, this file may be used under the terms of the GNU
** General Public License version 3 or (at your option) any later version
** approved by the KDE Free Qt Foundation. The licenses are as published by
** the Free Software Foundation and appearing in the file LICENSE.GPL3
** included in the packaging of this file. Please review the following
** information to ensure the GNU General Public License requirements will
** be met: https://www.gnu.org/licenses/gpl-3.0.html.
**
** $QT_END_LICENSE$
**
****************************************************************************/
#include "themewidget.h"
#include 简单易懂酷炫的界面,强大,如果 自己写的话 装Qt 的时候 要安装 QChart 模块,并且在程序的开头加上一句 using namespace Qtcharts或者一个宏 QT_CHARTS_USE_NAMESPACE 否则找不到 QChart !!