2020武汉新型肺炎数据分析
关于2020年冠状病毒肺炎的数据分析
突如其来的冠状病毒使得人心惶惶,对我来说,最明显的变化便是假期越来越长了,宅家里的日子太难了!实在闲得无聊,我便利用python,通过数学模型预测一下肺炎的传播:
1.利用历史数据对未来的感染人数做预测:这是一个较为简单的预测模型,可以有以下几种思路:
(1)利用历史数据进行拟合,得到拟合曲线后预测未来几天可能的感染数,但效果一般都不是太好
(2)使用时间序列模型如ARIMA对未来几天的感染人数进行预测
(3)使用神经网络如LSTM训练预测模型。
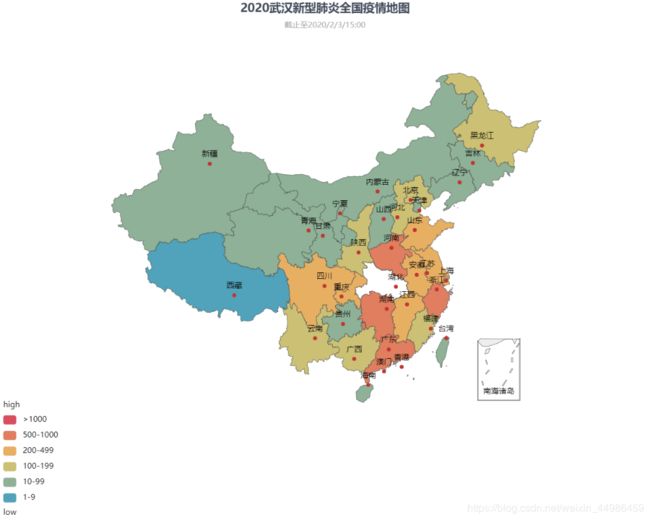
2.用pyecharts绘制2020武汉新型肺炎全国疫情地图
1.指数回归对确诊人数进行预测
在这里我使用指数函数对确诊人数的历史数据进行了拟合计算,并等待官方更新后的确诊人数进行比较,发现指数回归所预测的确诊人数结果偏高。
在下图指数函数对历史数据进行拟合的模型中,给出的预测结果为:2月1号和2月2号确诊人数分别为16092人和20967人,但官方给出的实时数据则为14380人和17205人,预测的误差在1000-4000人之间,可见指数拟合的方法预测并不可靠,存在较大的误差。
数据爬取日期:2020年1月31日 23点
源码:

from scipy.optimize import curve_fit
import urllib
import json
import numpy as np
import seaborn as sns
import matplotlib.pyplot as plt
import pandas as pd
import plotly.express as px
from sklearn.pipeline import Pipeline
from sklearn.preprocessing import PolynomialFeatures
from sklearn import linear_model
import scipy as sp
from scipy.stats import norm
import time
import datetime
from dateutil.parser import parse

def date_change(date):
    date = '2020/' + date
    timeArray = time.strptime(date, "%Y/%m/%d")
    otherStyleTime = time.strftime("%Y/%m/%d", timeArray)
    return otherStyleTime

def change_time(date):
    t1 = date[-1]
    today = parse(t1)
    tomorrow = today + datetime.timedelta(days=1)
    second_day = tomorrow + datetime.timedelta(days=1)
    next_day = str(tomorrow)[0:11].replace('-', '/')
    next_day_2 = str(second_day)[0:11].replace('-', '/')
    date.append(next_day)
    date.append(next_day_2)
    return date

def date_encode(date):
    d = date.split('/')
    month, day = int(d[0]), int(d[1])
    return 100 * month + day

def date_decode(date):
    return '{}.{}'.format(str(date // 100), str(date % 100))

def sequence_analyse(data):
    date_list, confirm_list, dead_list, heal_list, suspect_list,date = [], [], [], [], [] , []
    data.sort(key=lambda x: date_encode(x['date']))
    for day in data:
        date.append(date_change(day['date']))
        date_list.append(date_encode(day['date']))
        confirm_list.append(int(day['confirm']))
        dead_list.append(int(day['dead']))
        heal_list.append(int(day['heal']))
        suspect_list.append(int(day['suspect']))
    return pd.DataFrame({
        'date': date_list,
        'confirm': confirm_list,
        'dead': dead_list,
        'heal': heal_list,
        'suspect': suspect_list
    }),date

url = 'https://view.inews.qq.com/g2/getOnsInfo?name=wuwei_ww_cn_day_counts'
response = urllib.request.urlopen(url)
json_data = response.read().decode('utf-8').replace('\n', '')
data = json.loads(json_data)
data = json.loads(data['data'])

df,date = sequence_analyse(data)
x, y = df['date'].values[:-1], df['confirm'].values[:-1]
x_idx = list(np.arange(len(x)))
date = change_time(date)

def func(x, a, b, c):
    return a * np.exp(b * x) + c

plt.figure(figsize=(15, 8))
plt.scatter(x, y, color='purple', marker='x', label="History data")
plt.plot(x, y, color='gray', label="History curve")
popt, pcov = curve_fit(func, x_idx, y)

test_x = x_idx + [i + 2 for i in x_idx[-2:]]
label_x = np.array(test_x) + 113
index_x = np.array(date)
test_y = [func(i, popt[0], popt[1], popt[2]) for i in test_x]
plt.plot(label_x, test_y, 'g--', label="Fitting curve")
plt.title("{:.4}·e^{:.4}+({:.4})".format(popt[0], popt[1], popt[2]), loc="center", pad=-40)
plt.scatter(label_x[-2:], test_y[-2:], marker='x', color="red", linewidth=7, label="Predicted data")
plt.xticks(label_x, index_x,rotation=45)
plt.ylim([-500, test_y[-1] + 2000])
plt.legend()

for i in range(len(x)):
    plt.text(x[i], test_y[i] + 200, y[i], ha='center', va='bottom', fontsize=12, color='red')
for a, b in zip(label_x, test_y):
    plt.text(a, b + 800, int(b), ha='center', va='bottom', fontsize=12)

plt.show()
2.用pyecharts绘制2020武汉新型肺炎全国疫情地图
以上用指数回归的方法预测了一下确诊人数,但却没有一个更直观的描述出确诊人数的分布,在中国各省份的具体分布。因此,在这里我用爬虫爬取了腾讯新型冠状肺炎病情实时跟踪上的信息便于进行准确的分析。
在下图中可以明显的观察到,除了新型肺炎主要分布于毗邻湖北省的区域,沿海发达地区确诊人数较多,观察地图可以得到春运肺炎传播对沿海地区影响最大,此地区人口流动较多,使得新型肺炎传播较为严重。
因此,希望大家重视此次新型肺炎,毕竟从图中可以看到新型肺炎传播的范围这么大,希望大家都健健康康度过这段日子哈哈哈

数据来源:腾讯新型冠状肺炎病情实时跟踪
数据爬取日期:2020年2月3日 15点
源码:

from bs4 import BeautifulSoup
from selenium import webdriver
import pandas as pd
from pyecharts import Bar
from pyecharts import Geo
from pyecharts import Map

Province_list,Confirm_list,Heal_list,Dead_list = [],[],[],[]
driver_path = r'F:\Python-Study-Files\anzhuang\chromedriver\chromedriver.exe'
driver = webdriver.Chrome(executable_path=driver_path)
driver.get("https://news.qq.com//zt2020/page/feiyan.htm")
html = driver.page_source
driver.quit()
soup = BeautifulSoup(html, 'lxml')

h2_list = soup.find_all('h2',class_='blue')
for h2 in h2_list[1:35]:
    Province_name = h2.get_text()
    Province_list.append(Province_name)

confirm_list = soup.find_all('div',class_='confirm')
for confirm in confirm_list[3:37]:
    confirm_list = confirm.get_text()
    Confirm_list.append(confirm_list)

heal_list = soup.find_all('div',class_='heal')
for heal in heal_list[0:34]:
    heal_list = heal.get_text()
    Heal_list.append(heal_list)

dead_list = soup.find_all('div',class_='dead')
for dead in dead_list[3:37]:
    dead_list = dead.get_text()
    Dead_list.append(dead_list)

map = Map("2020武汉新型肺炎全国疫情地图", "截止至2020/2/3/15:00",title_color="#404a59", title_pos="center",width=1000,height=800)
map.add("",Province_list,Confirm_list,is_map_symbol_show=True,maptype='china',is_visualmap=True,is_piecewise=True,visual_text_color='#000',
             is_label_show=True, pieces=[
            {"max": 10000, "min": 1001, "label": ">1000"},
            {"max": 1000, "min": 500, "label": "500-1000"},
            {"max": 499, "min": 200, "label": "200-499"},
            {"max":199,"min":100,"label":"100-199"},
            {"max":99,"min":10,"label":"10-99"},
             {"max":9,"min":1,"label":"1-9"}])
map.render("2020武汉新型肺炎全国疫情地图.html")
第一次写博客,希望多多指正!
参考:
https://blog.csdn.net/qq_26822029/article/details/104106679
https://blog.csdn.net/weixin_43746433/article/details/91346371
