R语言gganimate疫情数据动态可视化
R语言gganimate学习
所需加载包
library(av)
library(ggplot2)
library(gganimate)
library(tidyverse)
library(lubridate)
library(scales)
library(ggrepel)
library(cowplot)
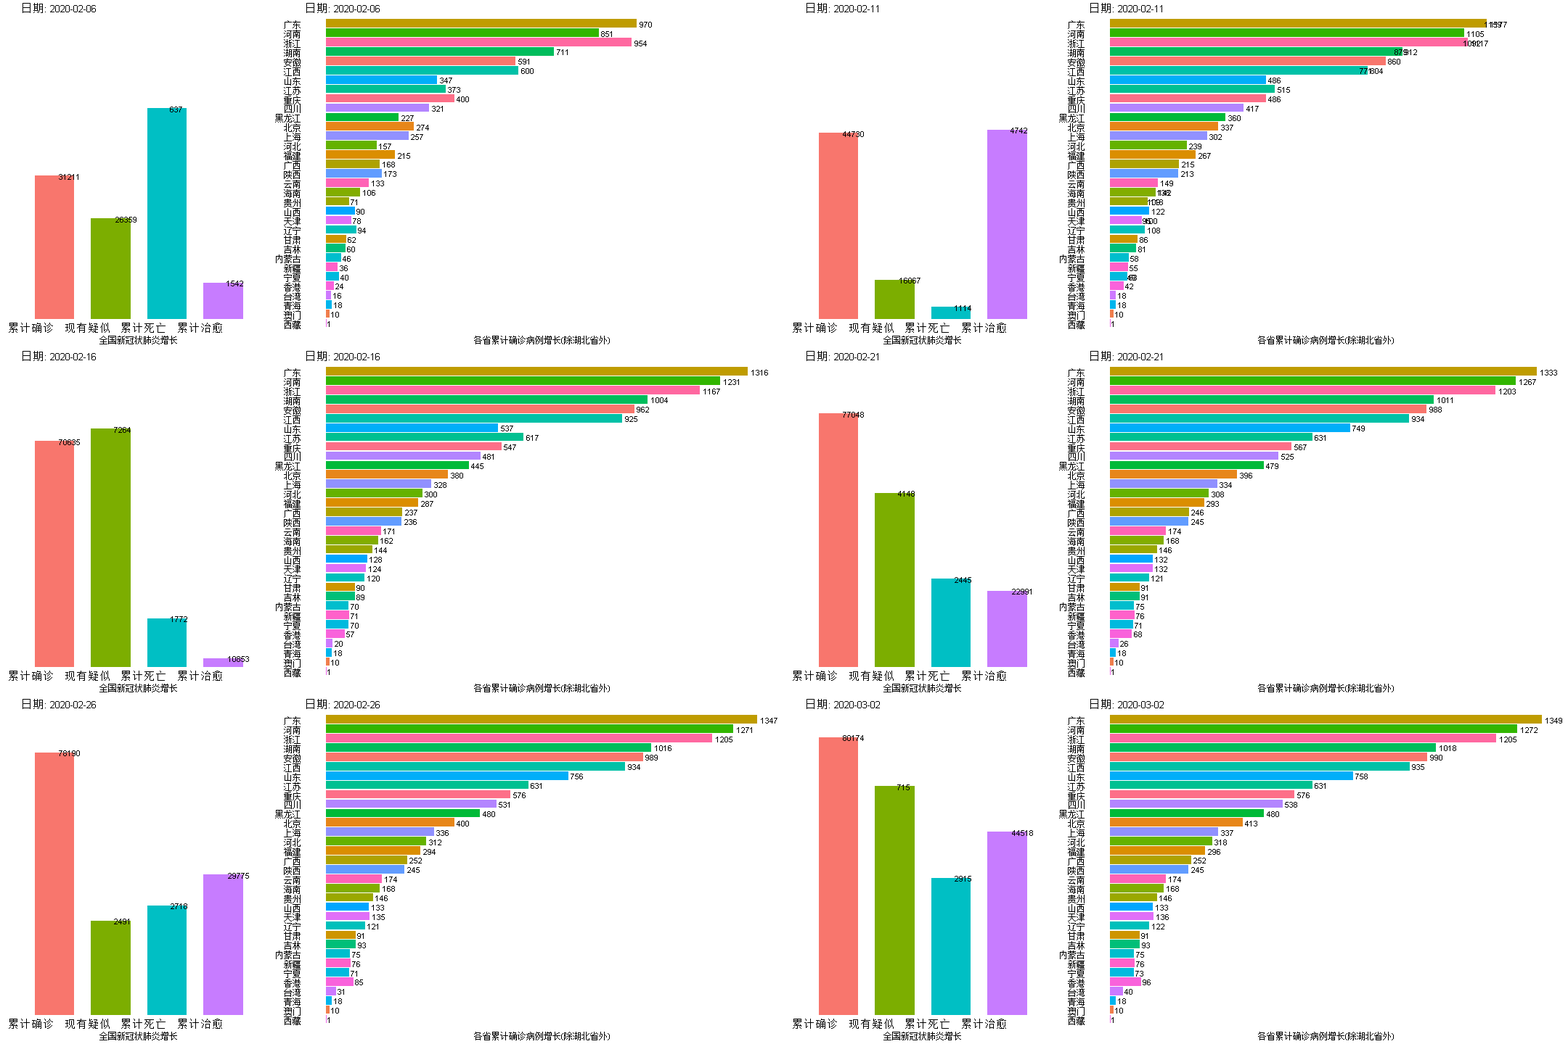
ps = ggplot(mydatan, aes(x=reorder(省份, 累计确诊),y=累计确诊, fill=省份,frame=Date)) +
     geom_bar(stat= 'identity', position = 'dodge',show.legend = FALSE) +
    geom_text(aes(label=paste0(累计确诊)),col="black",hjust=-0.2)+
    #theme_bw()+
   #theme(legend.position="none") +
    theme(axis.text.x = element_text(size = 12,angle = 90, hjust = 0.2, vjust = 0.2),legend.position="none") +
    theme(panel.background=element_rect(fill='transparent'))+
  theme(axis.text.y=element_text(angle=0,colour="black",size=12,hjust=1))+
  theme(axis.text.x=element_text(angle=0,colour="white",size=2,hjust=1))+
   theme(panel.grid =element_blank()) +   ## 删去网格线
  theme(axis.text = element_blank()) +   ## 删去所有刻度标签
  theme(axis.ticks = element_blank()) +  ## 删去所有刻度线
# Here comes the gganimate specific bits
#labs(title = '日期:', x = '省份', y = '累计确诊病例') +
#annotate("text",x=0,y=40,label=C[i],parse=T)+
coord_flip()+
transition_manual(frames=as.Date(Date)) +
#ggdark::dark_theme_bw() + #设置黑色主题
labs(title = paste('日期:', '{current_frame}'),x = '', y ='各省累计确诊病例增长(除湖北省外)')+
ease_aes('linear')
ps
#df <- animate(ps, renderer = av_renderer('animation.mp4'),
         #     width = 1280, height = 720, res = 100, fps = 10)#视频制作
# av_encode_video(df, 'output.mp4', framerate = 2,audio ="N.mp3")
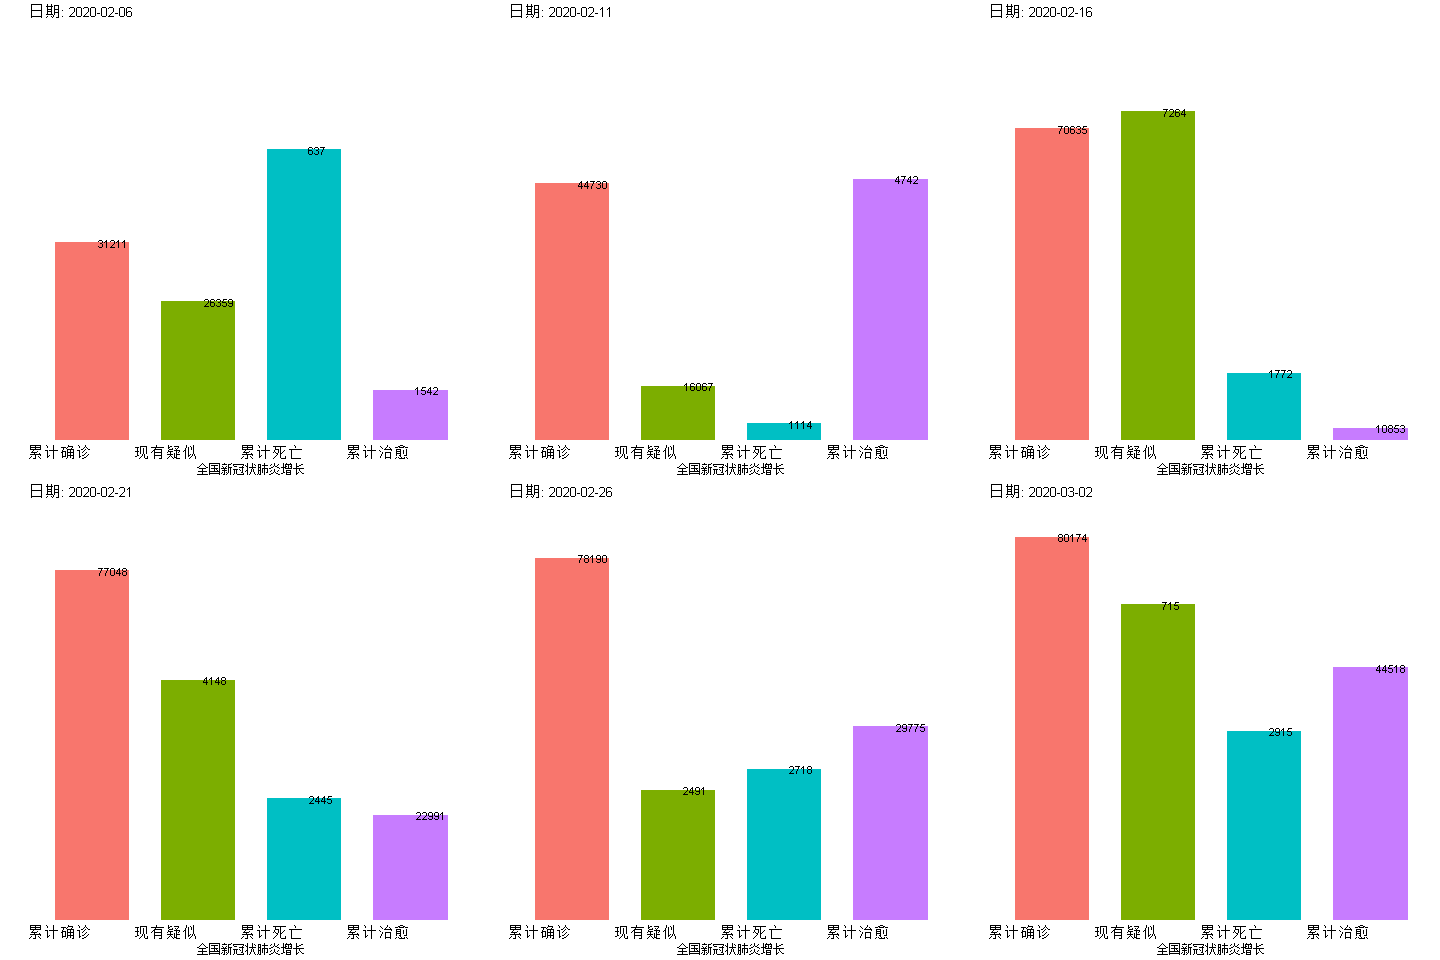
全国新冠状肺炎26天增长状况
pc<-ggplot(data=CNdata_s,aes(x=variable,y=value,fill=variable,frame=Date))+
   geom_bar(stat= 'identity', position = 'dodge',show.legend = FALSE,width=0.7) +
   geom_text(aes(label=paste0(value)),col="black",hjust=-0.2)+
    theme(legend.position="none") +
  theme(panel.background=element_rect(fill='transparent'))+
  theme(axis.text.x=element_text(angle=0,colour="black",size=15,hjust=1))+
  theme(axis.text.y=element_text(angle=0,colour="white",size=2,hjust=1))+
   theme(panel.grid =element_blank()) +   ## 删去网格线
  theme(axis.text = element_blank()) +   ## 删去所有刻度标签
  theme(axis.ticks = element_blank()) +  ## 删去所有刻度线
  #scale_x_continuous(limits = c(0,6))+
 # Here comes the gganimate specific bits
#labs(title = '日期:', x = '省份', y = '累计确诊病例') +
#annotate("text",x=0,y=40,label=C[i],parse=T)+
    # coord_flip()+
     transition_manual(frames=as.Date(Date)) +
    # ggdark::dark_theme_bw() + #设置黑色主题
     labs(title = paste('日期:', '{current_frame}'),x = '全国新冠状肺炎增长', y ='')+
     ease_aes('linear')
pc
library(magick)
ps_gif <- animate(ps,,width = 720, height = 480)
pc_gif <- animate(pc, width = 360, height = 480)
ps_gifs <- image_read(ps_gif)
pc_gifs <- image_read(pc_gif)
new_gif <- image_append(c(pc_gifs[1], ps_gifs[1]))
for(i in 2:length(pc_gifs)){
  combined <- image_append(c(pc_gifs[i], ps_gifs[i]))
  new_gif <- c(new_gif, combined)
}
new_gif


