Twitter情绪分析全面教程指导--基于实际数据集和代码实战
目录
Introduction
1. Understand the Problem Statement
2. Tweets Preprocessing and Cleaning
3. Story Generation and Visualization from Tweets
4. Extracting Features from Cleaned Tweets
5. Model Building: Sentiment Analysis
6. What’s Next?
End Notes
原文标题:Comprehensive Hands on Guide to Twitter Sentiment Analysis with dataset and code
原文链接:https://www.analyticsvidhya.com/blog/2018/07/hands-on-sentiment-analysis-dataset-python/
Introduction
自然语言处理(NLP)是当今数据科学研究的温床,情绪分析是NLP最常见的应用之一。从民意调查到创建整个营销策略,这一领域完全改变了商业运作的方式,这就是为什么它是每个数据科学家都必须熟悉的领域。
对于情感(以及其他特征,包括命名实体、话题、主题等),数千个文本文档可以在数秒内处理,而一组人手工完成同样的任务需要数小时。
在本文中,我们将学习如何解决Twitter情绪分析实践问题。
我们将按照解决一般情绪分析问题所需要的一系列步骤来做到这一点。我们将首先对tweet的原始文本进行预处理和清理。然后,我们将探索已清理的文本,并试图获得一些关于tweet上下文的直观感受。之后,我们将从数据中提取数值特征,最后使用这些特征集来训练模型并识别tweet的情绪(情感)。
这是NLP中最有趣的挑战之一,所以我很高兴能和你们一起踏上这段旅程!
1. Understand the Problem Statement
让我们看一下问题陈述(研究的问题),因为在处理数据集之前,理解目标是非常重要的。问题陈述如下:
这个任务的目的是在tweet中检测仇恨言论。为了简单起见,如果推特上有种族主义或性别歧视的情绪,我们会说它含有仇恨言论。因此,任务是将种族主义或性别歧视的推文从其他推文中进行分类。
正式地说,给定一个tweet和标签的训练样本,其中标签“1”表示tweet是种族主义/性别歧视者,标签“0”表示tweet不是种族主义/性别歧视者,您的目标是预测给定测试数据集上的标签。
注意:这个实践问题的评价指标是F1-Score。
就我个人而言,我很喜欢这个任务,因为仇恨言论、恶意挑衅和社交媒体欺凌在当今已经成为严重的问题,一个能够检测到此类文本的系统,肯定会对让互联网和社交媒体成为一个更好、无恶意的地方发挥巨大作用。现在让我们详细地看看每一步。
2. Tweets Preprocessing and Cleaning
看看下面的图片,描绘了一个办公空间的两个场景——一个是凌乱的,另一个是整洁有序的。

你正在这个办公室里寻找一份文件。在哪种情况下,您更容易找到文档?当然,在不那么混乱的地方,因为每一项都保持在适当的位置。数据清理工作非常相似。如果数据以结构化的格式排列,那么就更容易找到正确的信息。
文本数据的预处理是一个必要的步骤,因为它使原始文本准备好便于进行后续的数据挖掘工作,即:让从文本中提取信息,并将机器学习算法应用到该数据集,变得更加容易。如果我们跳过这一步,那么您处理嘈杂和不一致的数据的概率就会更高。这一步骤的目标是清除那些对于发现tweet情感无关紧要的内容或信息,诸如标点符号、特殊字符、数字和和在文本上下文中没有多大权重的术语。
在后面的一个阶段中,我们将从Twitter文本数据中提取数字特性。这个特性空间是使用整个数据中出现的所有惟一单词创建的。因此,如果我们能很好地预处理我们的数据,那么我们就能得到一个更好质量的特性空间。
让我们首先读取数据并加载必要的库。您可以从这里下载数据集。
import re
import pandas as pd
import numpy as np
import matplotlib.pyplot as plt
import seaborn as sns
import string
import nltk
import warnings
warnings.filterwarnings("ignore", category=DeprecationWarning)

%matplotlib inline

train  = pd.read_csv('train_E6oV3lV.csv')
test = pd.read_csv('test_tweets_anuFYb8.csv')

#说明:本教程的代码请在jupyter notebook 或者ipython中运行查看
#Let’s check the first few rows of the train dataset.
train.head()
数据有3列:id、label和tweet。label是二进制目标变量,tweet包含我们要清理和预处理的tweet。
查看前5条记录后,我们可以想到的初始的数据清理需求:
- 由于隐私问题,Twitter句柄已经被伪装成@user。因此,这些Twitter句柄几乎没有提供任何关于Twitter本质的信息。
- 我们还可以考虑去掉标点、数字甚至特殊字符,因为它们无助于区分不同类型的tweet。
- 大多数较短的单词并没有增加太多的价值。例如,' pdx ', ' his ', ' all '。因此,我们将尝试从我们的数据中删除它们。
- 一旦我们执行了上述三个步骤,我们就可以将每个tweet分成单独的单词或令牌,这是任何NLP任务的关键步骤。
- 在第4条推文中,有一个词“love”。在其余的数据中,我们可能也有诸如loves, loving, lovable等词。这些术语经常在相同的上下文中使用。如果我们可以把它们简化为它们的词根,即“love”,那么我们就可以在不丢失大量信息的情况下减少数据中唯一的单词的数。
A) Removing Twitter Handles (@user)
如上所述,tweet包含许多twitter句柄(@user),这是twitter用户在twitter上确认的方式。我们将从数据中删除所有这些twitter句柄,因为它们不能传递太多信息。
为了方便起见,我们首先将train和test数据集合并,这样就省去了在test和train上重复执行相同步骤的麻烦。
combi = train.append(test, ignore_index=True)下面是一个用户定义的函数,用于从tweet中删除不需要的文本模式。它有两个参数,一个是原始的文本字符串,另一个是我们想从字符串中删除的文本模式。函数返回相同的输入字符串,但是没有给定的模式。我们将使用此函数从数据中的所有tweet中删除模式“@user”。
def remove_pattern(input_txt, pattern):
    r = re.findall(pattern, input_txt)
    for i in r:
        input_txt = re.sub(i, '', input_txt)

    return input_txt
现在让我们创建一个新的列tidy_tweet,它将包含经过清理和处理的tweet。注意,我们已经将“@[\w]*”作为模式传递给remove_pattern函数。它实际上是一个正则表达式,它将选择以“@”开始的任何单词。
# remove twitter handles (@user)
combi['tidy_tweet'] = np.vectorize(remove_pattern)(combi['tweet'], "@[\w]*")
B) Removing Punctuations, Numbers, and Special Characters
如前所述,标点、数字和特殊字符并没有多大帮助。最好从文本中删除它们,就像删除twitter句柄一样。在这里,我们将替换除开以# (twitter trends)开头的字符和术语之外的所有内容。
# remove special characters, numbers, punctuations
combi['tidy_tweet'] = combi['tidy_tweet'].str.replace("[^a-zA-Z#]", " ")
C) Removing Short Words
在选择要删除的词的长度时,我们需要小心一点。所以,我决定删除所有长度为3或小于3的单词。例如,像“hmm”, “oh” 这样的词几乎没什么用。最好把它们处理掉。
combi['tidy_tweet'] = combi['tidy_tweet'].apply(lambda x: ' '.join([w for w in x.split() if len(w)>3]))

#Let’s take another look at the first few rows of the combined dataframe.
combi.head()
您可以很清楚地看到原始tweet和清理tweet (tidy_tweet)之间的区别。只有tweet中的重要词被保留,噪声(数字、标点和特殊字符)被删除。
D) Tokenization
现在,我们将在数据集中切分所有已清理的tweet。标记(tokens)是单独的术语或单词,分词(tokenization)是将文本字符串分割为标记的过程。
tokenized_tweet = combi['tidy_tweet'].apply(lambda x: x.split())
tokenized_tweet.head()
E) Stemming
词干是一种基于规则的过程,它从一个单词中去掉后缀(“ing”、“ly”、“es”、“s”等)。例如,“play”、“player”、“played”、“plays”和“playing”是“play”的不同变体。
from nltk.stem.porter import *
stemmer = PorterStemmer()

tokenized_tweet = tokenized_tweet.apply(lambda x: [stemmer.stem(i) for i in x]) # stemming
tokenized_tweet.head()
3. Story Generation and Visualization from Tweets
在本节中,我们将探究已清理的tweet文本。探索和可视化数据,无论它是文本或任何其他数据,都是获得直观认识的重要步骤。这里探讨了标签和数据中最常见的单词。不要把自己局限于这些方法,尽可能多地探索数据。
在我们开始探索之前,我们必须思考并提出与手头数据相关的问题。以下是一些可能的问题:
- What are the most common words in the entire dataset?
- What are the most common words in the dataset for negative and positive tweets, respectively?
- How many hashtags are there in a tweet?
- Which trends are associated with my dataset?
- Which trends are associated with either of the sentiments? Are they compatible with the sentiments?
A) Understanding the common words used in the tweets: WordCloud
现在我想看看给定的情绪是如何分布在整个训练集上的。完成这个任务的一种方法是通过绘制文字云来理解常见的单词。
wordcloud是一种可视化,其中最常见的词以大尺寸字体表示,而不太常见的词以较小尺寸字体表示。
让我们用wordcloud绘图来可视化我们的数据。
all_words = ' '.join([text for text in combi['tidy_tweet']])
from wordcloud import WordCloud
wordcloud = WordCloud(width=800, height=500, random_state=21, max_font_size=110).generate(all_words)

plt.figure(figsize=(10, 7))
plt.imshow(wordcloud, interpolation="bilinear")
plt.axis('off')
plt.show()
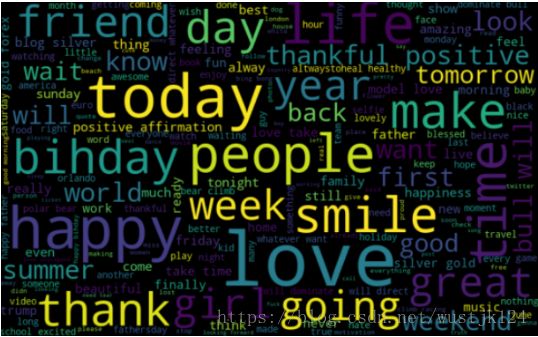
我们可以看到大多数的词是积极的或中性的。happy和love是最常见的。它没有给我们任何关于与种族主义/性别歧视的推特相关的词汇。因此,我们将在我们的训练集中分别为两个类(racist/sexist or not)绘制不同的词云。
B) Words in non racist/sexist tweets
normal_words =' '.join([text for text in combi['tidy_tweet'][combi['label'] == 0]])

wordcloud = WordCloud(width=800, height=500, random_state=21, max_font_size=110).generate(normal_words)
plt.figure(figsize=(10, 7))
plt.imshow(wordcloud, interpolation="bilinear")
plt.axis('off')
plt.show()
我们可以看到大多数的词是积极的或中性的。happy、smile和love是最常见的。因此,大多数频繁出现的词汇都与非种族主义者/非性别歧视主义者的言论一致。同样,我们将绘制另一种情绪相关tweet的词云。期待看到消极、种族主义和性别歧视的词汇。
C) Racist/Sexist Tweets
negative_words = ' '.join([text for text in combi['tidy_tweet'][combi['label'] == 1]])
wordcloud = WordCloud(width=800, height=500,
random_state=21, max_font_size=110).generate(negative_words)
plt.figure(figsize=(10, 7))
plt.imshow(wordcloud, interpolation="bilinear")
plt.axis('off')
plt.show()
我们可以清楚地看到,大多数词都有贬义。因此,我们似乎有很好的文本数据要处理。接下来我们将讨论twitter数据中的hashtags/trends。
D) Understanding the impact of Hashtags on tweets sentiment
推特上的Hashtags与推特上任何特定时刻的流行趋势是同义词。我们应该试着检查这些标签是否为我们的情绪分析任务增加了任何价值。,它们有助于将tweet区分为不同的情绪。
例如,下面给出的是来自我们数据集的tweet:
这条推文在本质上似乎是性别歧视的,推文中的标签传达了同样的感觉。
我们将把所有的趋势词汇分别存储在两个列表中——一个用于非种族主义/性别歧视的tweet,另一个用于种族主义/性别歧视的tweet。
# function to collect hashtags
def hashtag_extract(x):
    hashtags = []
    # Loop over the words in the tweet
    for i in x:
        ht = re.findall(r"#(\w+)", i)
        hashtags.append(ht)

    return hashtags

# extracting hashtags from non racist/sexist tweets
HT_regular = hashtag_extract(combi['tidy_tweet'][combi['label'] == 0])

# extracting hashtags from racist/sexist tweets
HT_negative = hashtag_extract(combi['tidy_tweet'][combi['label'] == 1])

# unnesting list
HT_regular = sum(HT_regular,[])
HT_negative = sum(HT_negative,[])
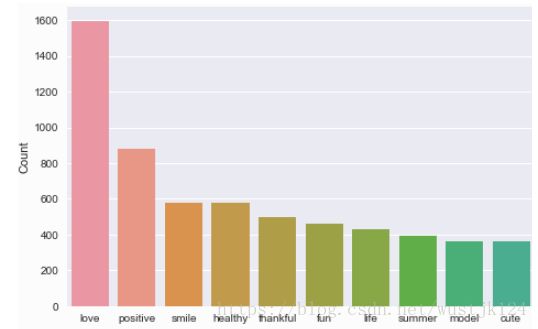
既然我们已经为这两种观点准备好了Hashtags列表,我们就可以绘制出数目最多的前n个hashtags了。所以,首先让我们检查一下非种族主义/性别歧视的tweet中的标签。
Non-Racist/Sexist Tweets
a = nltk.FreqDist(HT_regular)
d = pd.DataFrame({'Hashtag': list(a.keys()),
                  'Count': list(a.values())})
# selecting top 10 most frequent hashtags
d = d.nlargest(columns="Count", n = 10)
plt.figure(figsize=(16,5))
ax = sns.barplot(data=d, x= "Hashtag", y = "Count")
ax.set(ylabel = 'Count')
plt.show()
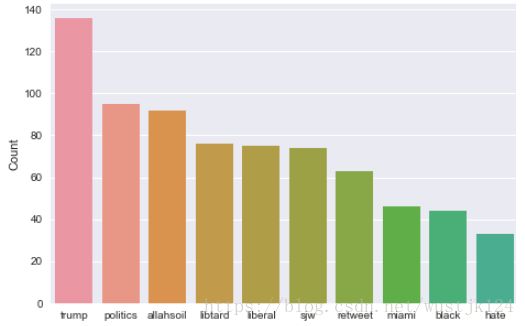
所有这些hashtag都是正面的,并且是有意义的。我希望在第二个列表的图中有负面的项。让我们来看看在种族主义/性别歧视的推文中出现的最常见的标签。
Racist/Sexist Tweets
b = nltk.FreqDist(HT_negative)
e = pd.DataFrame({'Hashtag': list(b.keys()), 'Count': list(b.values())})
# selecting top 10 most frequent hashtags
e = e.nlargest(columns="Count", n = 10)
plt.figure(figsize=(16,5))
ax = sns.barplot(data=e, x= "Hashtag", y = "Count")
ax.set(ylabel = 'Count')
plt.show()
正如预期的那样,大多数的项都是负面的,还有一些中性的项。因此,将这些标签保存在数据中并不是个坏主意,因为它们包含有用的信息。接下来,我们将尝试从分词后的tweet中提取特征。
4. Extracting Features from Cleaned Tweets
要分析预处理的数据,需要将其转换为特征。根据用法的不同,可以使用各种技术构建文本特征——词袋、TF-IDF和词嵌入。在本文中,我们将只讨论词袋和TF-IDF。
Bag-of-Words Features
Bag-of-Words is a method to represent text into numerical features. Consider a corpus (a collection of texts) called C of D documents {d1,d2…..dD} and N unique tokens extracted out of the corpus C. The N tokens (words) will form a list, and the size of the bag-of-words matrix M will be given by D X N(D篇文档,字典或词汇表的长度为N). Each row in the matrix M contains the frequency of tokens(词频) in document D(i).
Let us understand this using a simple example. Suppose we have only 2 document
D1: He is a lazy boy. She is also lazy.
D2: Smith is a lazy person.
The list created would consist of all the unique tokens in the corpus C.
= [‘He’,’She’,’lazy’,’boy’,’Smith’,’person’]
Here, D=2, N=6
The matrix M of size 2 X 6 will be represented as ––
Now the columns in the above matrix can be used as features to build a classification model. Bag-of-Words features can be easily created using sklearn’s CountVectorizer function. We will set the parameter max_features = 1000 to select only top 1000 terms ordered by term frequency across the corpus.
from sklearn.feature_extraction.text import CountVectorizer
bow_vectorizer = CountVectorizer(max_df=0.90, min_df=2, max_features=1000, stop_words='english')
# bag-of-words feature matrix
bow = bow_vectorizer.fit_transform(combi['tidy_tweet'])
TF-IDF Features
这是另一种基于词语频率的方法,但与词袋方法不同的是,它不仅考虑了单词在单个文档(或tweet)中出现的数目,还考虑了单词在整个语料库中出现的情况。
TF-IDF的工作原理是通过给常见单词分配较低的权重来惩罚它们,同时对那些在整个语料库中很少见但在少数文档中出现数目较多的单词给予重视(即分配较高的权重)。
让我们来看看与TF-IDF有关的重要术语:
- TF = (Number of times term t appears in a document)/(Number of terms in the document)
- IDF = log(N/n), where, N is the number of documents and n is the number of documents a term t has appeared in.
- TF-IDF = TF*IDF
from sklearn.feature_extraction.text import TfidfVectorizer
tfidf_vectorizer = TfidfVectorizer(max_df=0.90, min_df=2, max_features=1000, stop_words='english')
# TF-IDF feature matrix
tfidf = tfidf_vectorizer.fit_transform(combi['tidy_tweet'])
5. Model Building: Sentiment Analysis
现在,我们已经完成了获取数据的所有建模前的阶段。现在,我们将使用两个特性集——词袋和TF-IDF来构建数据集的预测模型。
我们将使用逻辑回归来构建模型。它通过将数据拟合到logit函数来预测事件发生的概率。
逻辑回归采用以下方程:
阅读这篇文章来了解更多关于逻辑回归的知识。
注意:如果您有兴趣尝试其他的机器学习算法,比如RandomForest、Support Vector machine或XGBoost,那么在https://trainings.analyticsvidhya.com会有一门关于情绪分析的完整课程。
A) Building model using Bag-of-Words features
from sklearn.linear_model import LogisticRegression
from sklearn.model_selection import train_test_split
from sklearn.metrics import f1_score

train_bow = bow[:31962,:]
test_bow = bow[31962:,:]

# splitting data into training and validation set
xtrain_bow, xvalid_bow, ytrain, yvalid = train_test_split(train_bow, train['label'], random_state=42, test_size=0.3)

lreg = LogisticRegression()
lreg.fit(xtrain_bow, ytrain) # training the model

prediction = lreg.predict_proba(xvalid_bow) # predicting on the validation set
prediction_int = prediction[:,1] >= 0.3 # if prediction is greater than or equal to 0.3 than 1 else 0
prediction_int = prediction_int.astype(np.int)

f1_score(yvalid, prediction_int) # calculating f1 score
Output: 0.525
We trained the logistic regression model on the Bag-of-Words features and it gave us an F1-score of 0.525 for the validation set(验证集). Now we will use this model to predict for the test data.
test_pred = lreg.predict_proba(test_bow)
test_pred_int = test_pred[:,1] >= 0.3
test_pred_int = test_pred_int.astype(np.int)
test['label'] = test_pred_int
submission = test[['id','label']]
submission.to_csv('sub_lreg_bow.csv', index=False) # writing data to a CSV file
The public leaderboard F1 score is 0.537(最优的F1值). Now we will again train a logistic regression model but this time on the TF-IDF features. Let’s see how it performs.
B) Building model using TF-IDF features
train_tfidf = tfidf[:31962,:]
test_tfidf = tfidf[31962:,:]

xtrain_tfidf = train_tfidf[ytrain.index]
xvalid_tfidf = train_tfidf[yvalid.index]

lreg.fit(xtrain_tfidf, ytrain)

prediction = lreg.predict_proba(xvalid_tfidf)
prediction_int = prediction[:,1] >= 0.3
prediction_int = prediction_int.astype(np.int)

f1_score(yvalid, prediction_int)
Output: 0.538
The public leaderboard F1 score is 0.541. So, both validation score and public leaderboard score have improved in the case of TF-IDF feature space.(性能相对与词袋特征集有所提升)
6. What’s Next?
如果您有兴趣了解更高级的情绪分析技术,我们有一个很好的免费课程,为您提供关于同样的问题的解决方案,很快将在https://trainings.analyticsvidhya.com/发布。本课程将有先进的技术,如word2vec模型用于特征提取,更多的机器学习算法,模型微调等。
在课程中,你会学到以下东西:
- Using Word Embeddings (word2vec and doc2vec) for creating better features.
- Applying advanced machine learning algorithms like SVM, RandomForest, and XGBoost.
- Model Fine-Tuning
- Creating custom metric
End Notes
在本文中,我们学习了如何处理情绪分析问题。我们从数据的预处理和探索开始。然后,我们使用词袋和TF-IDF从清理后的文本中提取特征。最后,我们能够使用这两个特性集构建两个模型来对tweet进行分类。


