学习https://seaborn.pydata.org 记录,描述不一定准确,具体请参考官网
%matplotlib inline
import numpy as np
import pandas as pd
from scipy import stats, integrate
import seaborn as sns
import matplotlib.pyplot as plt
from matplotlib.font_manager import FontProperties
myfont=FontProperties(fname=r'C:\Windows\Fonts\simhei.ttf',size=14)
sns.set(font=myfont.get_name(), color_codes=True)
np.random.seed(sum(map(ord, "categorical")))
titanic = sns.load_dataset("titanic")
tips = sns.load_dataset("tips")
iris = sns.load_dataset("iris")
tips[::25].head()
|
total_bill |
tip |
sex |
smoker |
day |
time |
size |
| 0 |
16.99 |
1.01 |
Female |
No |
Sun |
Dinner |
2 |
| 25 |
17.81 |
2.34 |
Male |
No |
Sat |
Dinner |
4 |
| 50 |
12.54 |
2.50 |
Male |
No |
Sun |
Dinner |
2 |
| 75 |
10.51 |
1.25 |
Male |
No |
Sat |
Dinner |
2 |
| 100 |
11.35 |
2.50 |
Female |
Yes |
Fri |
Dinner |
2 |
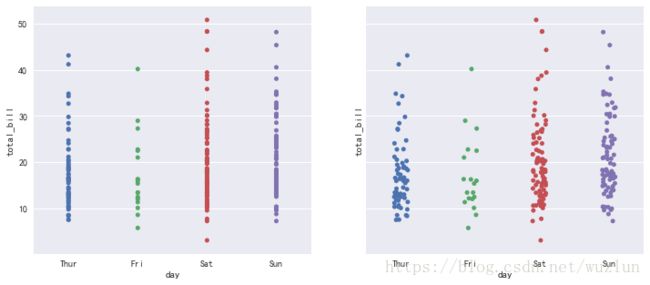
1、stripplot() 条形散点-重叠
fig, axes = plt.subplots(1,2,figsize=(12, 5),sharex=True, sharey=True)
sns.stripplot(x="day", y="total_bill", data=tips, ax=axes[0])
sns.stripplot(x="day", y="total_bill", data=tips, jitter=True, ax=axes[1])
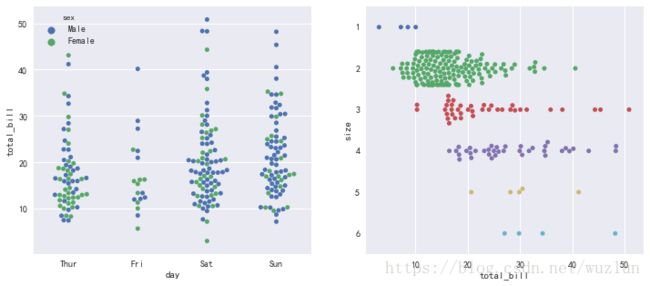
2、swarmplot() 条形散点-不重叠
fig, axes = plt.subplots(1,2,figsize=(12, 5))
sns.swarmplot(x="day", y="total_bill",  hue="sex", data=tips, ax=axes[0])
sns.swarmplot(x="total_bill", y="size", data=tips, orient='h', ax=axes[1])
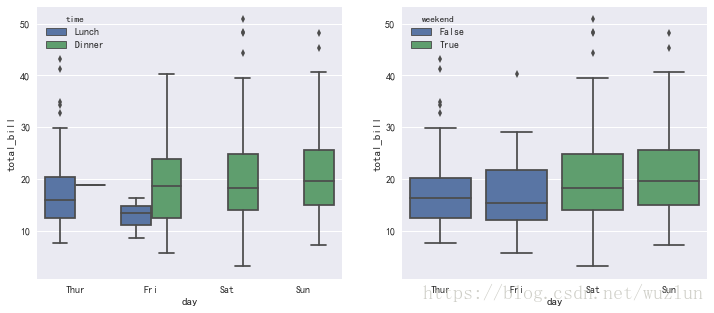
3、boxplot() 箱形图
fig, axes = plt.subplots(1,2,figsize=(12, 5))
sns.boxplot(x="day", y="total_bill", hue="time", data=tips, ax=axes[0])
tips["weekend"] = tips["day"].isin(["Sat", "Sun"])
sns.boxplot(x="day", y="total_bill", hue="weekend", data=tips, dodge=False, ax=axes[1])
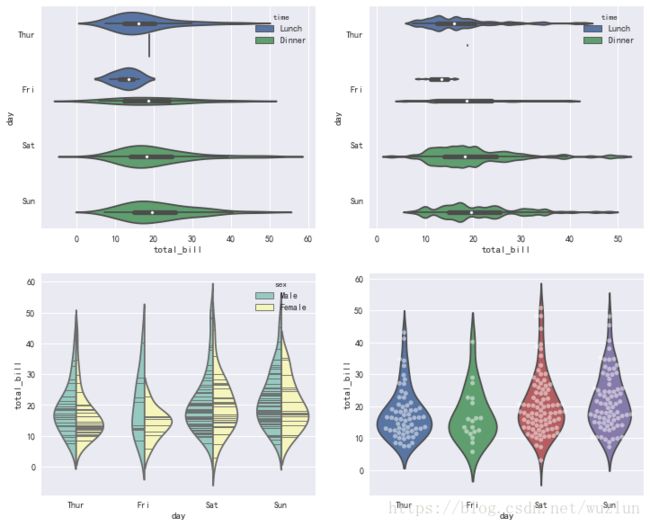
4、violinplot() 琴形图
fig, axes = plt.subplots(2,2,figsize=(12, 10))
sns.violinplot(x="total_bill", y="day", hue="time", data=tips,ax=axes[0,0])
sns.violinplot(x="total_bill", y="day", hue="time", data=tips,bw=.1, scale="count", scale_hue=False,ax=axes[0,1])
sns.violinplot(x="day", y="total_bill", hue="sex", data=tips,split=True, inner="stick", palette="Set3",ax=axes[1,0])
sns.violinplot(x="day", y="total_bill", data=tips, inner=None,ax=axes[1,1])
sns.swarmplot(x="day", y="total_bill", data=tips, color="w", alpha=.5,ax=axes[1,1])
titanic[::-20][::10]
|
survived |
pclass |
sex |
age |
sibsp |
parch |
fare |
embarked |
class |
who |
adult_male |
deck |
embark_town |
alive |
alone |
| 890 |
0 |
3 |
male |
32.0 |
0 |
0 |
7.7500 |
Q |
Third |
man |
True |
NaN |
Queenstown |
no |
True |
| 690 |
1 |
1 |
male |
31.0 |
1 |
0 |
57.0000 |
S |
First |
man |
True |
B |
Southampton |
yes |
False |
| 490 |
0 |
3 |
male |
NaN |
1 |
0 |
19.9667 |
S |
Third |
man |
True |
NaN |
Southampton |
no |
False |
| 290 |
1 |
1 |
female |
26.0 |
0 |
0 |
78.8500 |
S |
First |
woman |
False |
NaN |
Southampton |
yes |
True |
| 90 |
0 |
3 |
male |
29.0 |
0 |
0 |
8.0500 |
S |
Third |
man |
True |
NaN |
Southampton |
no |
True |
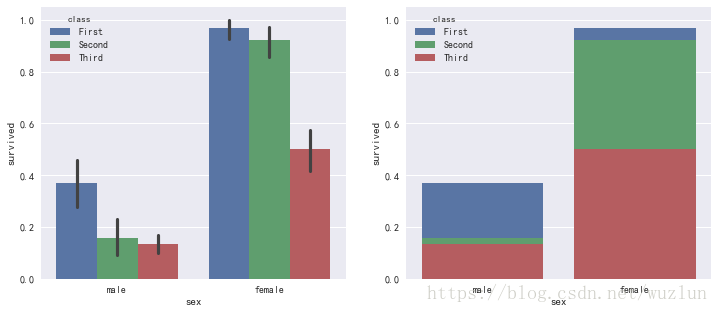
5、barplot() 柱状图
fig, axes = plt.subplots(1,2,figsize=(12, 5))
sns.barplot(x="sex", y="survived", hue="class", data=titanic,ax=axes[0])
sns.barplot(x="sex", y="survived", hue="class", data=titanic, dodge=False, errwidth=0, ax=axes[1])
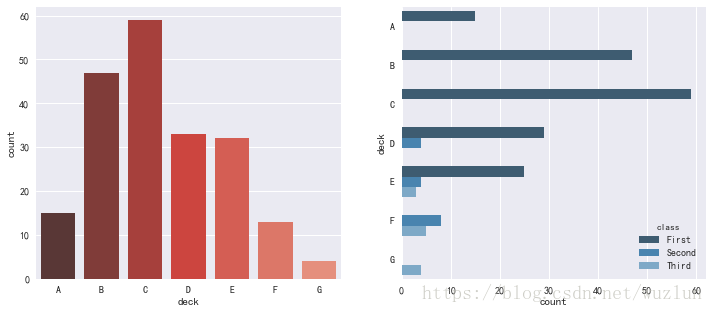
6、countplot() 柱状图-统计
fig, axes = plt.subplots(1,2,figsize=(12, 5))
sns.countplot(x="deck", data=titanic, palette="Reds_d", ax=axes[0])
sns.countplot(y="deck", hue="class", data=titanic, palette="Blues_d", ax=axes[1])
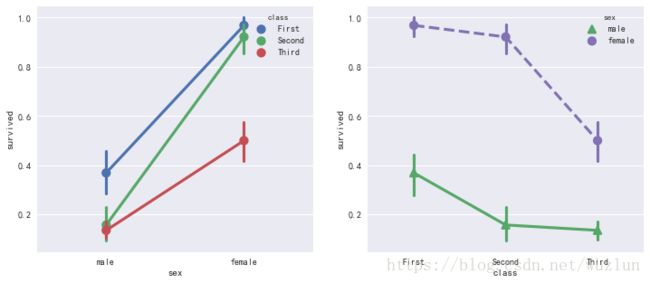
7、pointplot() 两点关系
fig, axes = plt.subplots(1,2,figsize=(12, 5))
sns.pointplot(x="sex", y="survived", hue="class", data=titanic, ax=axes[0])
sns.pointplot(x="class", y="survived", hue="sex", data=titanic, ax=axes[1],
              palette={"male": "g", "female": "m"},
              markers=["^", "o"], linestyles=["-", "--"]);
8、多变量分类绘图 factorplot()
fig, axes = plt.subplots(1,2,figsize=(12, 5))
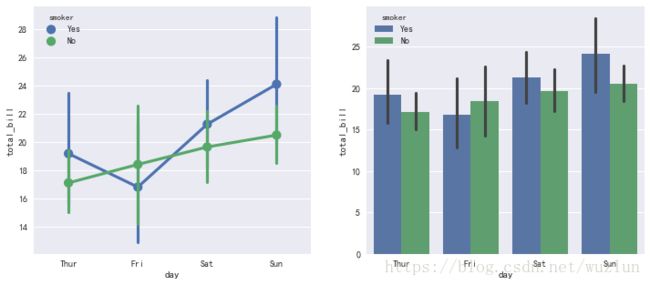
sns.factorplot(x="day", y="total_bill", hue="smoker", data=tips, ax=axes[0])
sns.factorplot(x="day", y="total_bill", hue="smoker", data=tips, kind='bar', ax=axes[1])
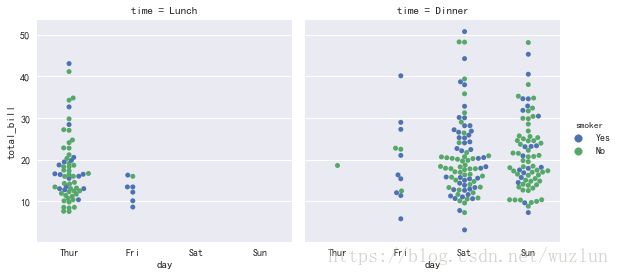
sns.factorplot(x="day", y="total_bill", hue="smoker",col="time", data=tips, kind="swarm")
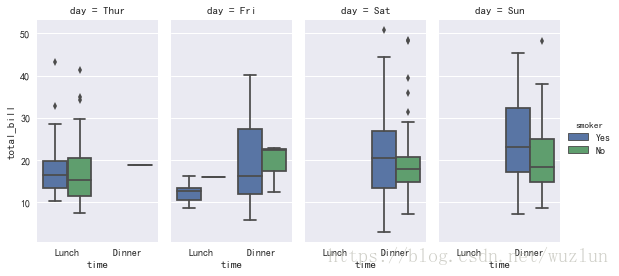
sns.factorplot(x="time", y="total_bill", hue="smoker",
               col="day", data=tips, kind="box", size=4, aspect=.5)
8、多变量分类绘图 PairGrid()
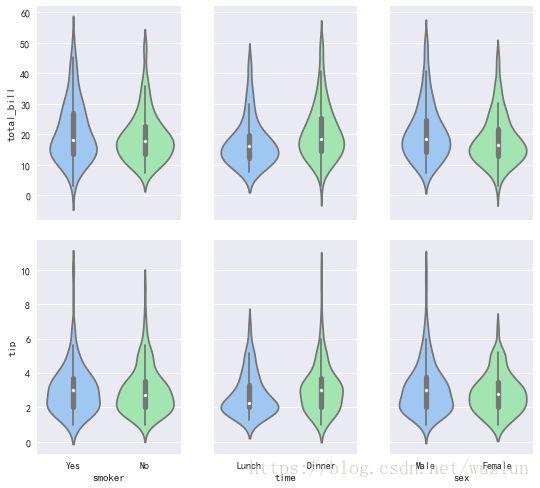
g = sns.PairGrid(tips,
                 x_vars=["smoker", "time", "sex"],
                 y_vars=["total_bill", "tip"],
                 aspect=.75, size=3.5)
g.map(sns.violinplot, palette="pastel")
