优达无人驾驶入门——交通信号灯分类器
这是我第一次写博客,有我解释不清楚或者不懂的地方欢迎随时提问。
本人是在读研一学生一枚,想从事与无人驾驶方面,但学校导师没有人从事无人驾驶方面,
所以目前在优达学城学无人驾驶,如有喜欢无人驾驶方面的人希望可以一起学习交流。
下面是项目的大概总结:在这个项目中,你将使用计算机视觉技术的知识为交通信号灯图像建立一个分类器!你会获得一个交通信号灯图像数据集,里面包含三种交通信号灯,即红灯、黄灯或绿灯,其中,三分之一的灯是亮起的。
下面正式开始!
1. 加载交通信号灯数据集,并将其可视化
我是在jupyter notebook环境下编程的,首先是导入必要的库和资源
import cv2
import helpers

import random
import numpy as np
import matplotlib.pyplot as plt
import matplotlib.image as mpimg # for loading in images

%matplotlib inline
读取图片
IMAGE_DIR_TRAINING = "traffic_light_images/training/"
IMAGE_DIR_TEST = "traffic_light_images/test/"
IMAGE_LIST = helpers.load_dataset(IMAGE_DIR_TRAINING)
可视化数据:分析任何一个数据集的前两个步骤都是:1.加载数据;2.查看数据。看一看这些数据,你就会知道要在图像中寻找什么,需要处理什么样的噪音或不一致性等。这可以帮助你了解图像数据集,并且明白了解数据集是对数据进行预测的一部分。
这是是显示出红灯和黄灯,可以自行修改数值来查看图片。
yellow_image = IMAGE_LIST[750][0]
print("yellow_image.shape = ",yellow_image.shape)
plt.subplot(121)
plt.title("yellow image")
plt.imshow(yellow_image)

selected_image = IMAGE_LIST[0][0]
print("red_image.shape = ",IMAGE_LIST[0][0].shape)
plt.subplot(122)
plt.title("red image")
plt.imshow(selected_image)
plt.show()
yellow_image.shape = (47, 21, 3)
red_image.shape = (60, 27, 3)
2. 预处理数据
这里我们把图片都变为32*32的格式
def standardize_input(image):

    ## TODO: Resize image and pre-process so that all "standard" images are the same size
    standard_im = np.copy(image)
    standard_im = cv2.resize(standard_im,(32,32))


    return standard_im
实现独热编码
这里是当是红灯时返回的时[1,0,0],绿灯返回的是[0,0,1]
def one_hot_encode(label):

    ## TODO: Create a one-hot encoded label that works for all classes of traffic lights
    one_hot_encoded = []
    if label == "red":
        return [1,0,0]
    elif label == "yellow":
        return [0,1,0]
    else:
        return [0,0,1]
测试你的代码
# Importing the tests
import test_functions
tests = test_functions.Tests()

# Test for one_hot_encode function
tests.test_one_hot(one_hot_encode)构建一个输入图像并输出标签的STANDARDIZED_LIST 函数
def standardize(image_list):

    # Empty image data array
    standard_list = []

    # Iterate through all the image-label pairs
    for item in image_list:
        image = item[0]
        label = item[1]

        # Standardize the image
        standardized_im = standardize_input(image)

        # One-hot encode the label
        one_hot_label = one_hot_encode(label)

        # Append the image, and it's one hot encoded label to the full, processed list of image data
        standard_list.append((standardized_im, one_hot_label))

    return standard_list

# Standardize all training images
STANDARDIZED_LIST = standardize(IMAGE_LIST)
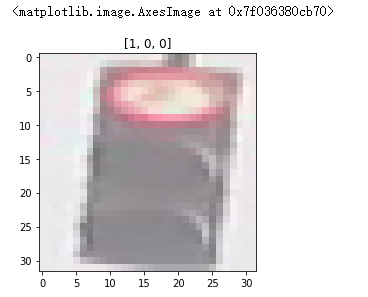
将标准化数据可视化
显示来自STANDARDIZED_LIST的标准化图像,并将其与来自IMAGE_LIST的非标准化图像进行比较。请注意,它们的尺寸和外观是不同的
standard_image = STANDARDIZED_LIST[525][0]
print(standard_image.shape)
plt.title(STANDARDIZED_LIST[0][1])
plt.imshow(standard_image)
(32, 32, 3)
3. 特征提取(这里开始是重点)
现在,你需要根据颜色空间、形状分析和特征构建方面的现有知识来创建特征,帮助区分和分类三种类型的交通信号灯图像。
你需要创建至少一项特征(可选择创建更多特征)。必需的特征是使用HSV颜色空间创建的亮度特征:
-
亮度特征。
- 使用HSV颜色空间,创建一个特征,可用于帮你识别3种不同类别的交通信号灯。
- 稍后,你需要回答一个问题,即你刚刚试图用哪些方法来识别交通信号灯。所以,当你浏览这个notebook 时,需要一直思考你要使用的方法:什么方法有效,什么方法不可行?
-
(可选):创建更多特征!
是否要创建更多特征,这取决于你,但是你创建的特征应该能提高交通信号灯分类算法的准确度!有一点需要注意的是,要通过这个项目,绝不能将任何一个红灯归类为绿灯,因为这会对无人驾驶汽车造成严重的安全风险。为了避免这种错误分类,你可以考虑添加另一个特别区分红灯和绿灯的特征。
这些特征将会被合并在这个 notebook 的末尾处,从而形成一个完整的分类算法。
RGB到HSV的转换
下面,将测试图像从RGB转换为HSV颜色空间,并将每个组件显示在图像中。
image_num = 800
test_im = STANDARDIZED_LIST[image_num][0]
test_label = STANDARDIZED_LIST[image_num][1]

# Convert to HSV
hsv = cv2.cvtColor(test_im, cv2.COLOR_BGR2HSV)

# Print image label
print('Label [red, yellow, green]: ' + str(test_label))

# HSV channels
h = hsv[:,:,0]
s = hsv[:,:,1]
v = hsv[:,:,2]

# Plot the original image and the three channels
f, (ax1, ax2, ax3, ax4) = plt.subplots(1, 4, figsize=(20,10))
ax1.set_title('Standardized image')
ax1.imshow(hsv)
ax2.set_title('H channel')
ax2.imshow(h,cmap = 'gray')
ax3.set_title('S channel')
ax3.imshow(s, cmap='gray')
ax4.set_title('V channel')
ax4.imshow(v, cmap='gray')
(实现):创建一个使用HSV颜色空间的亮度特征
这里是先裁剪一下图片,把一些背景去除
def crop_image(image):
    row_crop = 4
    col_crop = 7

    return image[row_crop:-row_crop,col_crop:-col_crop,:]
这里是程序的关键,我的思路是,先读取一张图片,然后裁剪后,是24*18的大小的图片,也就是有24*18个像素格,那么我一个一个的判断这每个格子的颜色的阈值,如果一个小格里是红色,那么我就red_y加1,如果是绿色就green_y加1这样。最后判断哪个大,比如是red_y大,那么就认为图片是红灯
def create_feature(rgb_image):

    #blur_image = cv2.medianBlur(rgb_image,3)

    croped_image = crop_image(rgb_image)

    hsv = cv2.cvtColor(croped_image, cv2.COLOR_RGB2HSV)

    H = hsv[:,:,0]
    S = hsv[:,:,1]
    V = hsv[:,:,2]

    red_y = 0
    green_y = 0
    yellow_y = 0

    for i in range(24):
        red_y += sum( ( (H[i] <= 8) | ((H[i]>=160) & (H[i] <= 180))) & ( S[i] >=43 ) & (V[i] >= 46))
        green_y += sum(( (H[i] >= 85)&(H[i] <= 110) ) & (S[i] >=43) & (V[i] >= 46))
        yellow_y += sum((H[i] <= 25) & (S[i] >= 43) & (V[i] >= 45))

    if((red_y > green_y) and (red_y>yellow_y)):
               return[1,0,0]
    if((green_y>red_y) and (green_y > yellow_y)):
               return [0,0,1]
    if((yellow_y > red_y) and (yellow_y > green_y)):
               return [0,1,0]


    return [1,0,0]
4. 进行分类,并将错误可视化
构建一个完整的分类器
def estimate_label(rgb_image):

    ## TODO: Extract feature(s) from the RGB image and use those features to
    ## classify the image and output a one-hot encoded label
    predicted_label = create_feature(rgb_image)

    return predicted_label
测试数据集
TEST_IMAGE_LIST = helpers.load_dataset(IMAGE_DIR_TEST)

# Standardize the test data
STANDARDIZED_TEST_LIST = standardize(TEST_IMAGE_LIST)

# Shuffle the standardized test data
random.shuffle(STANDARDIZED_TEST_LIST)
确定准确度
def get_misclassified_images(test_images):
    # Track misclassified images by placing them into a list
    misclassified_images_labels = []

    # Iterate through all the test images
    # Classify each image and compare to the true label
    for image in test_images:

        # Get true data
        im = image[0]
        true_label = image[1]
        assert(len(true_label) == 3), "The true_label is not the expected length (3)."

        # Get predicted label from your classifier
        predicted_label = estimate_label(im)
        assert(len(predicted_label) == 3), "The predicted_label is not the expected length (3)."

        # Compare true and predicted labels
        if(predicted_label != true_label):
            # If these labels are not equal, the image has been misclassified
            misclassified_images_labels.append((im, predicted_label, true_label))

    # Return the list of misclassified [image, predicted_label, true_label] values
    return misclassified_images_labels


# Find all misclassified images in a given test set
MISCLASSIFIED = get_misclassified_images(STANDARDIZED_TEST_LIST)

# Accuracy calculations
total = len(STANDARDIZED_TEST_LIST)
num_correct = total - len(MISCLASSIFIED)
accuracy = num_correct/total

print('Accuracy: ' + str(accuracy))
print("Number of misclassified images = " + str(len(MISCLASSIFIED)) +' out of '+ str(total))
Accuracy: 0.9225589225589226
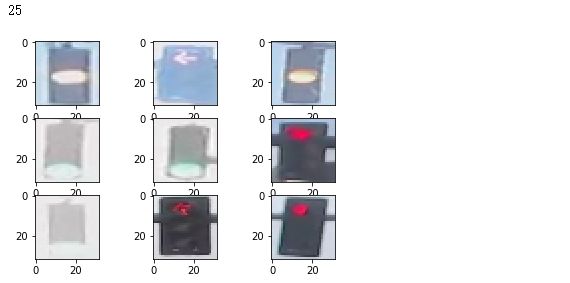
Number of misclassified images = 23 out of 297将错误分类的图像可视化
print(len(MISCLASSIFIED))

for i in range(9):
    plt.subplot(331+i)
    plt.imshow(MISCLASSIFIED[i][0])
测试你是否将某一个红灯归类为绿灯
要通过这个项目,你不能将任何一个红灯归类为绿灯!将红灯分类为绿灯会将导致汽车出现闯红灯行驶的情况,因此这种“把红灯误看做是绿灯”的错误在现实世界中非常危险。
import test_functions
tests = test_functions.Tests()

if(len(MISCLASSIFIED) > 0):
    # Test code for one_hot_encode function
    tests.test_red_as_green(MISCLASSIFIED)
else:
    print("MISCLASSIFIED may not have been populated with images.")
TEST PASSED
数据下载地址
链接:https://pan.baidu.com/s/1h-iYc35MT5_Y1ziapliT0Q
提取码:a425
(补)


