2017工业大数据 风机叶片预测练习
写在开头:老师给了数据集,主要练习对时间序列的操作,如果您想要了解更多的信息,本文参考价值不大,本文内容更适合机器学习初学者入门借鉴,有一套较为完整的从数据预处理至模型评价的流程。
本文简单总结了一些风机叶片预测问题中需要解决的问题与部分解决方案(采用的是基础的随机森林模型)。
解决的问题基于ypjbyc/01_叶片结冰预测/train/15文件夹中的39.39万条数据。
数据集的使用说明:
在ypjbyc/01_叶片结冰预测/train/15/中分别由三个csv文件:
-
15_data.csv:风机叶片数据集,包含time和其他27个特征。其中time是每一条数据的时间,需要依据下面两个时间表,对每一条数据是故障或是正常或是无效数据进行判断。
-
15_failureInfo:故障风机叶片时间数据,可以据此确定15_data中每一条故障数据的标签。
-
15_normalInfo:正常工作风机叶片时间数据,可以据此确定15_data中每一条正常工作数据的标签。
叶片预测数据集中需要解决的问题:
- 样本中存在停机、人为删除数据、无效数据等,会造成某些时间段的数据缺失 ,如何对缺失数据与数据不均匀问题进行处理?此外,叶片正常(normalInfo)与结冰故障(failureInfo)数据不均衡,该如何处理?
- 选取哪些特征用于模型预测?
- 何种训练模型比较适合本问题?
- 针对上述问题,从论文中摘出的一些解决方案:
在建立预测分类模型的时候,需要考虑风机结冰数据的类 不平衡问题。一般来说,对数据进行重采样能够有效降低类不 平衡带来的建模误差。将结冰样本进行过采样,将非结冰样本 进行欠采样,或者两者同时进行,以达到结冰和非结冰样本在 模型训练时有基本相近的比例。
如果我们能从序列数据中提取出易于分类的特征,就能够 准确地检测早期结冰。因此,在设计预测模型时,不仅要提供 瞬态特征,还要利用滑动窗提取给定长度下的统计特征。这些 统计特征能够很好地反映这一段序列数据的演化规律和状态, 因此能够更好的发现早期结冰。
我们根据训练数据中的 group 维度随机 地删除部分非结冰数据以及结冰严重数据,经过剔除数据处理, 正负样本所占比依然存在很大的差异,这种数据不平衡会对模 型最终的叶片结冰预测有非常大的影响,一般处理方式有三种:
欠采样、过采样、在模型 loss 函数中增加惩罚项以及模型集成。由于我们想尽可能的保留原始数据,因此选择第三种方法, 并且选取了更加适合此种情况的评价函数。
问题解决(仅供参考)
Step1 :读取数据并标注每条数据的标签
- 故障时间区间覆盖的数据行标记为1。
- 正常时间区间覆盖的数据行标记为0。
- 无效数据不参与评价。
- 数据集描述:
sum of data:393886
sum of failure data : 23846 , 6.05 %
sum of normal data : 350255 , 88.92 %
sum of invalid data : 19785 , 5.02 %
Step2:删除无效数据,选取此次要预测的数据(1/10),划分训练(2/3)与测试集(1/3)数据
-
删除19785条无效数据
-
剩下374101条有效数据
-
选取了1/10 39388个数据(乱序)
-
25064训练集(66.66%)
-
12346测试集(33.33%)
训练集中:
- failure:1627
- normal:23437
-
Step3 特征分析
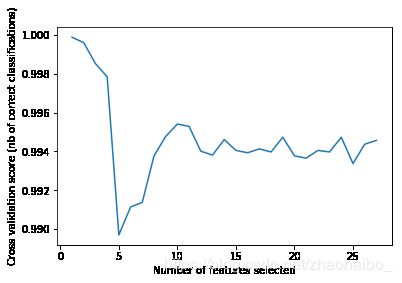
- 使用RFECV进行特征选择,以交叉验证分数高低决定选取的特征数量
- 对特征进行排名:
Ranking of features names: Index(['wind_direction', 'pitch1_moto_tmp', 'wind_direction_mean',
       'pitch2_speed', 'environment_tmp', 'pitch2_angle', 'acc_y',
       'pitch1_angle', 'pitch1_speed', 'yaw_speed', 'pitch1_ng5_DC',
       'pitch3_ng5_DC', 'group', 'pitch3_angle', 'pitch3_speed',
       'yaw_position', 'pitch3_moto_tmp', 'pitch2_ng5_DC', 'power',
       'generator_speed', 'acc_x', 'pitch2_moto_tmp', 'pitch3_ng5_tmp',
       'pitch2_ng5_tmp', 'int_tmp', 'pitch1_ng5_tmp', 'wind_speed'],
      dtype='object')
Ranking of features nums: [ 4 14  5 12 19  9 18  8 11  7 24 26 27 10 13  6 16 25  3  2 17 15 23 22
 20 21  1]
- 绘制交叉验证下的特征选择折线
- 选取得分前三的特征,绘制特征对比图
Step4 建立预测模型
- 这里选择的是随机森林分类模型
- 模型参数选择:
- 选择树的最⼤大深度为146
- 树的最⼤大节点数 2500
- 节点拆分最小用力数量:2
- 叶子结点最少样本数:2
- 集成决策树个数:2500
- 最少的叶子节点数:2500
- Bagging中每个字模型每次放回抽样选取的样本个数
- 当寻找最佳分割时要考虑的特征数量:sqrt
- 评价模型标准:Out Of Bag
Step5模型评价
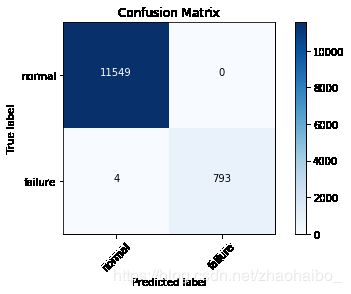
- accuracy_score:0.9998005106926269(该结果可能与选取训练集的随机度不够高有关)
- 混淆矩阵:
-
评分
               precision    recall  f1-score   support

          0       1.00      1.00      1.00     11549
          1       1.00      0.99      1.00       797
avg / total       1.00      1.00      1.00     12346
Python代码
#!/usr/bin/env python3
# -*- coding: utf-8 -*-
"""
Created on Sun Aug 19 11:18:38 2018

@author: zhaohaibo
"""

import os
os.chdir('C:\\Users\\zhaohaibo\\Desktop\\ypjbyc\\01_叶片结冰预测\\train\\15')#运行前更改目录为train/15这个文件夹
import pandas as pd
import numpy as np

# Step1 读取数据
data = pd.read_csv("15_data.csv")
total = len(data)
print("sum of data:%d" % total)
des = data.describe()
fail_data = pd.read_csv("15_failureInfo.csv")
normal_data = pd.read_csv("15_normalInfo.csv")


# 对时间标签做处理,分类出label:
# label = 1: 故障时间区域
# label = 0: 正常时间区域
# label = -1:无效数据


# 转化data时间列为datetime
times = []
for i in range(len(data)):
    dt = pd.to_datetime(data.ix[i][0])
    times.append(dt)
    if(i%10000==0):
        print("complete %d / %d" % (i,len(data)))
times = pd.Series(times)
data.time = times

# 转化normal_data & fail_data时间列为datetime
def to_datetime(obj_pd):
    Ser1 = obj_pd.iloc[:,0]
    Ser2 = obj_pd.iloc[:,1]
    for i in range(len(Ser1)):
        Ser1[i] = pd.to_datetime(Ser1[i])
        Ser2[i] = pd.to_datetime(Ser2[i])
    obj_pd.iloc[:,0] = Ser1
    obj_pd.iloc[:,1] = Ser2
    return obj_pd

normal_data = to_datetime(normal_data)
fail_data = to_datetime(fail_data)

# 根据datetime创建labels列表
labels = []
for i in range(len(times)):
    if(i%10000==0):
        print("complete %d / %d" % (i,len(times)))
    flag = 0
    for j in range(len(normal_data)):
        if((times[i] >= normal_data.startTime[j]) and (times[i] <= normal_data.endTime[j])):
            labels.append(0)
            flag = 1
            break
    for j in range(len(fail_data)):
        if(flag==1):
            break
        elif((times[i] >= fail_data.startTime[j]) and (times[i] <= fail_data.endTime[j])):
            labels.append(1)
            flag = 1
            break
    if(flag == 1):
        continue
    labels.append(-1)
print("complete all")

# print 数据信息
def data_judge(labels,total):
    sum_inv = 0
    for i in range(len(labels)):
        if(labels[i] == -1):
            sum_inv = sum_inv + 1
    print("sum of invalid data : %d , %.2f %%" % (sum_inv,sum_inv/total*100))

    sum_nor = 0
    for i in range(len(labels)):
        if(labels[i] == 0):
            sum_nor = sum_nor + 1
    print("sum of normal data : %d , %.2f %% " % (sum_nor,sum_nor/total*100))

    sum_fail = 0
    for i in range(len(labels)):
        if(labels[i] == 1):
            sum_fail = sum_fail + 1
    print("sum of failure data : %d , %.2f %% " % (sum_fail,sum_fail/total*100))
data_judge(labels,total)

# 删除无效数据
y = labels
indexes = []
for i in range(len(y)):
    if(y[i] == -1):
        indexes.append(i)
data = data.drop(indexes)
data = data.drop('time',axis=1)
for i in range(len(y)-1,-1,-1):
    if(y[i]==-1):
        y.pop(i)

# Step2 数据预处理,这里为了节约时间,仅使用百分之10的数据作训练和预测(其实更多比例也不会特别费时)
from sklearn.model_selection import train_test_split
# 随机选择百分之10的数据
X_train, X_test, y_train, y_test = train_test_split(data, y, test_size=0.9, random_state=666, shuffle = True)# shuffle默认为True
# 在选择的数据中,选择2/3作为训练集,1/3作为测试集
X_train, X_test, y_train, y_test = train_test_split(X_train, y_train, test_size=0.33, random_state=666, shuffle = False)# shuffle默认为True


# 归一化
from sklearn import preprocessing
min_max_scaler = preprocessing.MinMaxScaler()
X_train_scaled = min_max_scaler.fit_transform(X_train)
X_test_scaled = min_max_scaler.fit_transform(X_test)


# 特征选择
import matplotlib.pyplot as plt
from sklearn.svm import SVC
from sklearn.model_selection import StratifiedKFold
from sklearn.feature_selection import RFECV
from sklearn.datasets import make_classification
from sklearn.tree import DecisionTreeClassifier
svc = SVC(kernel="linear")
dt = DecisionTreeClassifier()
rfecv = RFECV(estimator=dt, step=1, cv=StratifiedKFold(2), scoring='accuracy')
rfecv.fit(X_train, y_train)
print("Optimal number of features : %d" % rfecv.n_features_)
print("Ranking of features names: %s" % X_train.columns[rfecv.ranking_-1])
print("Ranking of features nums: %s" % rfecv.ranking_)
plt.figure()
plt.xlabel("Number of features selected")
plt.ylabel("Cross validation score (nb of correct classifications)")
plt.plot(range(1, len(rfecv.grid_scores_) + 1), rfecv.grid_scores_)
plt.savefig("feature.jpg")
plt.show()


# 特征对比图
import seaborn as sns
sns.pairplot(X_train, vars=["wind_speed","generator_speed", "power"],
             palette="husl"
            ,diag_kind="kde")
plt.savefig("duibi.jpg")

# 网格搜索随机森林最佳参数
def GridsearchCV():
    param_grid = [
        {
            'n_estimators':[i for i in range(500,510)],
            'oob_score':True,
            'random_state':[i for i in range(30,50)],
            'min_samples_split':[i for i in range(2,20)],
            'max_depth': [i for i in range(100,200)],
        }]
    rf_clf = RandomForestClassifier(max_depth=146,n_estimators=500,
                                    max_leaf_nodes=2500, oob_score=True)
    grid_search = GridSearchCV(rf_clf, param_grid,n_jobs=-1)
    grid_search.fit(X,y)
    grid_search.best_score_
    grid_search.best_estimator_

# 使用随机森林分类器(直接使用网格搜索的最佳参数)
from sklearn.ensemble import RandomForestClassifier
rf_clf = RandomForestClassifier(max_depth=146,n_estimators=2500,
                                    max_leaf_nodes=2500, oob_score=True, random_state=30, n_jobs=-1)
rf_clf.fit(X_train, y_train)
y_predict = rf_clf.predict(X_test)
print(rf_clf.oob_score_)

# 绘制混淆矩阵
def plot_confusion_matrix(cm, classes, normalize=False,
                         title='Confusion matrix',
                         cmap=plt.cm.Blues):
    """
    Normalization can be applied by setting `normalize = True`.
    """
    plt.imshow(cm, interpolation='nearest',cmap=cmap)
    plt.title(title)
    plt.colorbar()
    tick_marks = np.arange(len(classes))
    plt.xticks(tick_marks, classes, rotation=45)
    plt.yticks(tick_marks, classes)

    if normalize:
        cm = cm.astype('float') / cm.sum(axis=1)[:,np.newaxis]
        print("Normalized confusion matrix")
    else:
        print("Confusion matrix, without normalization")
    print(cm)

    thresh = cm.max() / 2
    for i, j in itertools.product(range(cm.shape[0]),range(cm.shape[1])):
        plt.text(j, i, cm[i,j],
                horizontalalignment="center",
                color="white" if cm[i,j] > thresh else "black")

    plt.tight_layout()
    plt.ylabel('True label')
    plt.xlabel('Predicted label')
    plt.savefig("matrix.jpg")

from sklearn.metrics import confusion_matrix
import itertools
import matplotlib.pyplot as plt

prediction = rf_clf.predict(X_test)
cm = confusion_matrix(y_test, prediction)
cm_plot_labels = ['normal', 'failure']
plot_confusion_matrix(cm, cm_plot_labels, title='Confusion Matrix')


# 评价
#precision & recall & f1-score
from sklearn.metrics import classification_report
print(classification_report(y_true=y_test, y_pred=prediction))


