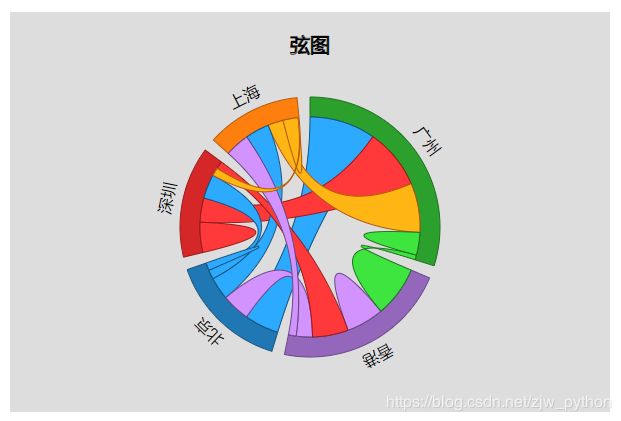
D3 二维图表的绘制系列(二十八)关系图-弦图 chord
上一篇: 日历热力图
下一篇: 径向树图
代码结构和初始化画布的Chart对象介绍,请先看 这里
本图完整的源码地址: 这里
1 图表效果
2 数据
{
  "citys": ["北京","上海","广州","深圳","香港"],
  "population": [
    [1000,3015,4567,1234,3714],
    [3214,2000,2060,124,3234],
    [8761,6545,3000,8045,647],
    [3211,1067,3214,4000,1006],
    [2146,1034,6745,4764,5000]
  ]
}
3 关键代码
导入数据
d3.json('./data.json').then(function(data){
.....
一些样式配置,例如内外半径
const config = {
        margins: {top: 80, left: 80, bottom: 50, right: 80},
        textColor: 'black',
        title: '弦图',
        hoverColor: 'white',
        innerRadius: 110,
        outerRadius: 130
    }
传入矩阵,进行数据和尺度的转换,调用d3.chord,配置弦图的布局信息,经处理后的数据将被转换为类似于树的节点+边的组合
/* ----------------------------尺度转换------------------------  */
    const chord = d3.chord()
                    .padAngle(0.1)
                    .sortGroups(d3.descending)     // 环状弦排列顺序
                    .sortSubgroups(d3.descending)  // 单个环状弦内部连接弦排列顺序
                    .sortChords(d3.descending);    //连接弦上下层叠顺序

    const handleData = chord(data.population);
渲染外环,绑定节点数组,运用d3.arc绘制圆环
/* ----------------------------渲染外环------------------------  */
    chart.renderRing = function(){
        const arc = d3.arc()
                        .innerRadius(config.innerRadius)
                        .outerRadius(config.outerRadius);

        const groups = chart.body()
                                .append('g')
                                .attr('class', 'chord')
                                .attr('transform', 'translate(' + chart.getBodyWidth()/2 + ',' + chart.getBodyHeight()/2 + ')')
                                .append('g')
                                .attr('class', 'groups')
                                .selectAll('g')
                                .data(handleData.groups);

              groups.enter()
                      .append('g')
                      .attr('class', (d) => d.index + ' g')
                      .append('path')
                      .attr('fill', (d) => chart._colors(d.index % 10))
                      .attr('stroke', (d) => d3.rgb(chart._colors(d.index % 10)).darker())
                      .attr('d', arc);
    }
渲染外环对应的文本标签,计算各文本坐标,然后旋转文本
/* ----------------------------渲染文本标签------------------------  */
    chart.renderText = function(){
        const radius = config.outerRadius + 10;

        d3.selectAll('.g')
            .append('text')
            .attr('class', (d) => 'label ' + d.index)
            .attr('x', (d) => radius * Math.sin((d.endAngle + d.startAngle)/2))
            .attr('y', (d) => -radius * Math.cos((d.endAngle + d.startAngle)/2))
            .attr('transform', (d) => 'rotate(' + 180 * (d.endAngle + d.startAngle) / 2 / Math.PI + ',' + radius * Math.sin((d.endAngle + d.startAngle)/2) + ',' + -radius * Math.cos((d.endAngle + d.startAngle)/2) + ')')
            .attr('text-anchor', 'middle')
            .text((d) => data.citys[d.index])
    }
渲染连线,调用d3.ribbon直接生成path
/* ----------------------------渲染连线------------------------  */
    chart.renderRibbon = function(){
        const ribbon = d3.ribbon()
                            .radius(config.innerRadius);

        const ribbons = d3.select('.chord')
                            .append('g')
                            .attr('class', 'ribbons')
                            .selectAll('path')
                            .data(handleData);

              ribbons.enter()
                        .append('path')
                        .attr('class', (d) => d.source.index + '-' + d.target.index)
                        .attr('fill', (d) => d3.rgb(chart._colors(d.target.index % 10)).brighter())
                        .attr('stroke', (d) => d3.rgb(chart._colors(d.target.index % 10)).darker())
                        .attr('d', ribbon);
    }
最后绑定鼠标交互事件,鼠标悬停在外环或连线时,突出显示
/* ----------------------------绑定鼠标交互事件------------------------  */
    chart.addMouseOn = function(){
        d3.selectAll('.g')
            .on('mouseenter', function(d){
                d3.selectAll('.ribbons path')
                    .filter((link) => link.target.index !== d.index && link.source.index !== d.index)
                    .classed('show', true);
            })
            .on('mouseleave', function(){
                d3.selectAll('.ribbons path')
                    .classed('show', false);
            });

        d3.selectAll('.ribbons path')
            .on('mouseenter', function(link){
                d3.selectAll('.g')
                    .filter((d) => link.target.index !== d.index && link.source.index !== d.index)
                    .selectAll('path')
                    .classed('show', true);

                d3.selectAll('.ribbons path')
                    .filter((d) => link !== d)
                    .classed('show', true);
            })
            .on('mouseleave', function(){
                d3.selectAll('.ribbons path')
                    .classed('show', false);

                d3.selectAll('.g path')
                    .classed('show', false);
            });
    }
大功告成!!!
![]()
