5. 模型训练和调参(The caret package)
1. 简介(The caret package )
2. 可视化(The caret package)
3. 预处理(The caret package)
4. 数据分割(The caret package)
5. 模型训练和调参
内容:
- Model Training and Parameter Tuning
- An Example
- Basic Parameter Tuning
- Notes on Reproducibility
- Customizing the Tuning Process
- Pre-Processing Options
- Alternate Tuning Grids
- Plotting the Resampling Profile
- The trainControl Function
- Alternate Performance Metrics
- Choosing the Final Model
- Extracting Predictions and Class Probabilities
- Exploring and Comparing Resampling Distributions
- Within-Model
- Between-Models
- Fitting Models Without Parameter Tuning
5.1 Model Training and Parameter Tuning
caret包有很多函数试图精简构建模型和评估模型的过程。
train 函数能用于:
* 评估,应用抽样,模型调参的影响
* 通过参数选择最优模型
* 从训练集中评估模型表现
首先,需要选择一个具体地模型。现在,有233个可以使用;详情请看train Model List 或 train Model By Tag,在这些介绍中,有一个可被优化的参数列表。用户也可以自定义模型。
第一步就是调整模型(算法中的第一行就是选择一系列要估计的参数。例如,如果要拟合一个偏最小二乘模型,需要设定PLS估计的参数。)
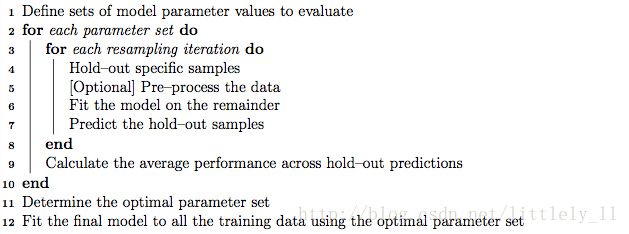
一旦模型和要调整的参数值被定义,重抽样的类型也就被设定了。现在,在train中可以使用k折交叉验证(一次或重复的),留一交叉验证和自助法等抽样方法。重抽样过后,这个过程将会指导用户选择哪个参数。默认地,函数自动选择具有拥有最佳值的参数,尽管可以使用不同的算法。
5.2 An Example
mlbench包中有一个Sonar数据集,这里,我们载入数据集:
library(mlbench)
data(Sonar)
str(Sonar[, 1:10])

## 'data.frame':    208 obs. of  10 variables:
##  $ V1 : num  0.02 0.0453 0.0262 0.01 0.0762 0.0286 0.0317 0.0519 0.0223 0.0164 ...
##  $ V2 : num  0.0371 0.0523 0.0582 0.0171 0.0666 0.0453 0.0956 0.0548 0.0375 0.0173 ...
##  $ V3 : num  0.0428 0.0843 0.1099 0.0623 0.0481 ...
##  $ V4 : num  0.0207 0.0689 0.1083 0.0205 0.0394 ...
##  $ V5 : num  0.0954 0.1183 0.0974 0.0205 0.059 ...
##  $ V6 : num  0.0986 0.2583 0.228 0.0368 0.0649 ...
##  $ V7 : num  0.154 0.216 0.243 0.11 0.121 ...
##  $ V8 : num  0.16 0.348 0.377 0.128 0.247 ...
##  $ V9 : num  0.3109 0.3337 0.5598 0.0598 0.3564 ...
## $ V10: num 0.211 0.287 0.619 0.126 0.446 ...函数createDataPartition能创建一个分层的随机样本进入训练集和测试集:
library(caret)
set.seed(998)
inTraining <- createDataPartition(Sonar$Class, p = .75, list = FALSE)
training <- Sonar[ inTraining,]
testing  <- Sonar[-inTraining,]
我们将会使用这些数据来说明这些函数功能。
5.3 Basic Parameter Tuning
默认为,简单自助抽样用于上图算法的第3行。像重复k折交叉验证和留一法也可以使用。函数trainControl用来设动抽样类型:
fitControl <- trainControl(## 10-fold CV
                           method = "repeatedcv",
                           number = 10,
                           ## repeated ten times
repeats = 10)更多关于trainControl的信息可以看下面章节。
train的前两个参数是预测变量和结果数据对象。第三个参数method设定模型类型(看train Model List 或 trian Model By Tag)。为了说明问题,我们会通过gbm包拟合一个boot tree模型。用重复交叉验证来拟合模型的基础语法为:
set.seed(825)
gbmFit1 <- train(Class ~ ., data = training,
                 method = "gbm",
                 trControl = fitControl,
                 ## This last option is actually one
                 ## for gbm() that passes through
                 verbose = FALSE)
gbmFit1

## Stochastic Gradient Boosting
##
## 157 samples
##  60 predictor
##   2 classes: 'M', 'R'
##
## No pre-processing
## Resampling: Cross-Validated (10 fold, repeated 10 times)
## Summary of sample sizes: 142, 142, 140, 142, 142, 141, ...
## Resampling results across tuning parameters:
##
##   interaction.depth  n.trees  Accuracy   Kappa
##   1                   50      0.7609191  0.5163703
##   1                  100      0.7934216  0.5817734
##   1                  150      0.7977230  0.5897796
##   2                   50      0.7858235  0.5667749
##   2                  100      0.8188897  0.6316548
##   2                  150      0.8194363  0.6329037
##   3                   50      0.7895686  0.5726290
##   3                  100      0.8130564  0.6195719
##   3                  150      0.8221348  0.6383441
##
## Tuning parameter 'shrinkage' was held constant at a value of 0.1
##
## Tuning parameter 'n.minobsinnode' was held constant at a value of 10
## Accuracy was used to select the optimal model using  the largest value.
## The final values used for the model were n.trees = 150,
##  interaction.depth = 3, shrinkage = 0.1 and n.minobsinnode = 10.
对于一个GBM模型,有三个主要的参数:
* 迭代次数, 例如,树(在gbm函数中叫做n.trees)
* 树的复杂度,称作interaction.depth
* 学习率:算法适应的有多快,叫做shrinkage
* 训练样本的最小数目(n.minobsinnode)
检测模型的默认值在前两列给出(shrinkage和n.minobsinnode没有给出是因为拥有这些参数的候选模型使用同样的值)。标有accuracy的这一列是通过交叉验证计算出的准确率。准确率的标准差从交叉验证结果中计算出。Kappa这一列是通过重抽样结果计算的Cohen Kappa统计量(非加权)。train函数用于具体的模型(见train Model List 和 train Mode By Tag)。对于这些模型,train函数创建一个调整参数组。默认的,如果p是调整参数的个数,那么,参数组的大小为 3p 。做为另一个例子,正则判别分析(RDA)模型有两个参数(gamma和lambda),两个参数数值都在0和1之间。默认的训练参数组将会在二维空间中产生9种组合。
在为train函数设定模型时有一些要点。在下一节将介绍train 的额外其他功能。
5.4 Notes on Reproducibility
很多模型在参数估计阶段应用随机数,重抽样切片也使用随机数,有两种主要的方法可以控制随机子以确保结果可重复。
* 有两种方法确保在调用train函数的时候有相同的重抽样本。第一种是在调用train之前使用set.seed函数。随机数生成重抽样信息。另外的,如果你愿意使用特定的数据分割,可以使用trainControl函数的index,这将会在下面讲到。
* 当使用重抽样的模型创建后,自己自也已经创建了。在调用train函数之前设定随机子能保证使用了相同 的随机数,当使用并行处理时这并不是一个问题。为了设定模型拟合随机子,trainControl需要调用另外一个参数seeds。这个参数是使用一个整数向量列表作为随机子。trainControl的帮助页面描述了这个选项的格式。
随机数怎样使用高度依赖包的作者。很少有目标模型没有控制生成随机数的,特别是在C代码中进行计算的。
5.5 Customizing the Tuning Process
有一些方法可以自定义参数选取和构建模型过程。
5.5.1 Pre-Processing Options
就像先前所提到的,train函数在模型拟合之前可以使用多种方法进行数据预处理。preProcess函数可以用来中心化和标准化,插值,空间符号变换和通过PCA或独立成分分析进行特征提取。
要怎么进行预处理,train函数有一个参数叫preProcess,这个参数会把方法传递到preProcess函数中,另外,preProcess也可以通过trainControl传递。
这些处理步骤将会应用于任何的预测过程,像predict.train, extractPrediction或extractProbs。预处理不会应用于直接使用object$finalModel这种对象的预测。
对于插值,有三种主要的实施方法:
- k最近邻处理带有缺失值的样本,并能在训练集中找到k个最近的样本。这k个训练集的值作为原始数据集的替代。当计算到训练集样本的距离的时候,用于计算的预测变量要求没有缺失值。
- 另一种方法是使用训练集对每一个预测变量拟合一个bag树。这是一个具有正常准确率的模型,并能处理缺失值。当一个预测变量需要插值的时候,其他预测变量将会通过bag树返回值,并且通过他们预测的值作为一个新值,但模型可能有很大的计算开销。
- 预测变量的中位数也可以用来估计缺失值。
如果在训练集中有缺失值,PCA和ICA只用其中的完整的样本。
5.5.2 Alternate Tuning Grids
调参网格可以由用户设定。参数tuneGrid可以传入一个数据框,列包含设定的参数。列名需要和拟合模型的参数名一致。对于前面提到的RDA的例子,参数名为gamma,lambda.train函数将会对每一行的参数值进行调整模型。
对于boost树模型,我们需要固定学习率,而去调整n.trees的参数:
gbmGrid <-  expand.grid(interaction.depth = c(1, 5, 9),
                        n.trees = (1:30)*50,
                        shrinkage = 0.1,
                        n.minobsinnode = 20)

nrow(gbmGrid)

set.seed(825)
gbmFit2 <- train(Class ~ ., data = training,
                 method = "gbm",
                 trControl = fitControl,
                 verbose = FALSE,
                 ## Now specify the exact models
                 ## to evaluate:
                 tuneGrid = gbmGrid)
gbmFit2

## Stochastic Gradient Boosting
##
## 157 samples
##  60 predictor
##   2 classes: 'M', 'R'
##
## No pre-processing
## Resampling: Cross-Validated (10 fold, repeated 10 times)
## Summary of sample sizes: 142, 142, 140, 142, 142, 141, ...
## Resampling results across tuning parameters:
##
##   interaction.depth  n.trees  Accuracy  Kappa
##   1                    50     0.75      0.50
##   1                   100     0.78      0.55
##   1                   150     0.79      0.58
##   1                   200     0.80      0.60
##   1                   250     0.80      0.60
##   1                   300     0.80      0.60
##   :                   :        :         :
##   9                  1350     0.82      0.64
##   9                  1400     0.82      0.64
##   9                  1450     0.82      0.64
##   9                  1500     0.82      0.64
##
## Tuning parameter 'shrinkage' was held constant at a value of 0.1
##
## Tuning parameter 'n.minobsinnode' was held constant at a value of 20
## Accuracy was used to select the optimal model using  the largest value.
## The final values used for the model were n.trees = 1000,
##  interaction.depth = 5, shrinkage = 0.1 and n.minobsinnode = 20.
如果训练集中有缺失值,PCA和ICA模型只会用完整的样本。
另一个选项是应用一个随机的参数组合,例如“随机搜索”,这个函数将在下面介绍。
要应用随机搜索,那就在调用trainControl的时候使用选项search = "random。这种情况下,tuneLength参数定义了要估计的参数组合的长度。
5.5.3 Plotting the Resampling Profile
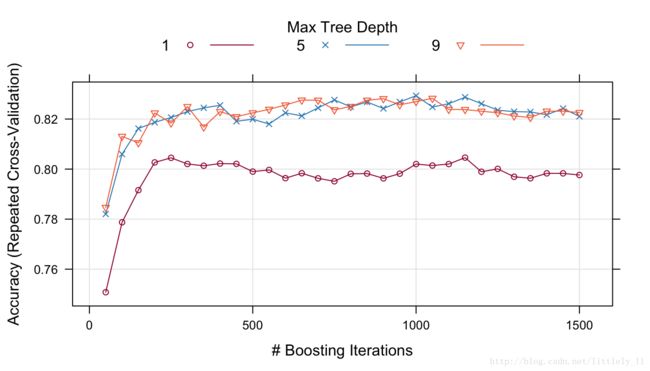
plot函数用于检验模型性能和调参之间的关系。例如,函数的调用展示了第一次拟合的结果:
trellis.par.set(caretTheme())
plot(gbmFit2)可以使用metric选项度量性能:
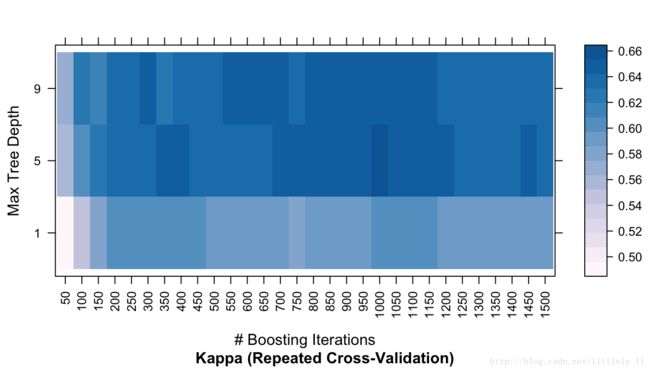
trellis.par.set(caretTheme())
plot(gbmFit2,metric = "Kappa")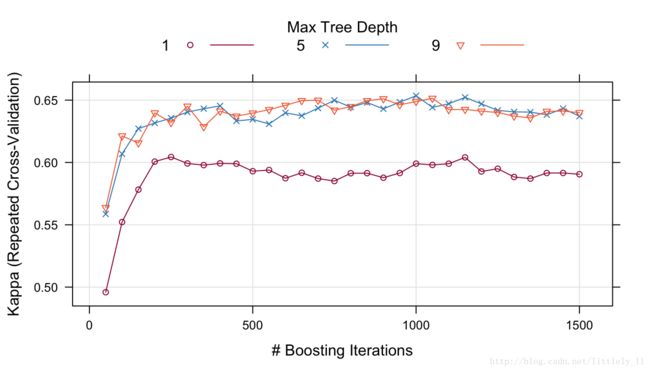
其他类型的作图也可以使用。详情请看?plot.train。下面的代码展现出了结果的热力图:
trellis.par.set(caretTheme())
plot(gbmFit2, metric = "Kappa", plotType = "level",
scales = list(x = list(rot = 90)))ggplot(gbmFit2)
## Warning: Ignoring unknown aesthetics: shape
也有其他作图函数展现抽样估计的更多细节。详情请看xyplot.train。
在这些图中可能需要一种不同的调参方式。要改变最终结果而不重新开始整个操作过程,update.train函数可用来重新拟合最终模型。可以看?update.train。
5.5.4 ThetrainControlFunction
trainControl函数产生参数是要控制用可能的值去创建模型:
method:重抽样方法:"boot","cv","LOOCV","LGOCV","repeatedcv","timeslice","none"和"oob"。最后一个出代估计(oob)只能应用于随机森林,袋装树,bagged earth,bagged flexible discriminant analysis或条件树森林模型。这并不包括GBM模型(gbm包作者指出,依照袋装树的OOB模型估计来选择调参并不是一个好主意)。对于留一法交叉验证,重抽样的性能度量并不能得到保证。number和repeats:number控制K折交叉验证的数目或者自助法和留组交叉验证的抽样迭代次数。假设method = "repeatedcv",number = 10和repeates = 3,3个分开的10折交叉验证作为重抽样的方案。verboseIter:输出训练日志的逻辑变量。returnData:逻辑变量,把数据保存到称作trainingData的一个节点。p:应用于LGOCV方法:训练比例。- 对于
method = "timeslice",trainControl拥有参数initialWindow,horizon和fixedWindow来控制交叉验证是怎样应用于时间序列数据的。classProbs:逻辑变量,决定是否计算类别概率。index和indexOut:每一次从抽样元素列表。每一个列表元素是用于迭代训练的样本行。当这些值没有设定时,train函数会产生它们。summaryFunction:用于计算备用性能的函数。selectionFunction:选择最佳参数的函数。PCAthresh:ICAcomp和k:这些选项传递到preProcss函数中去。returnResamp:包含一下值的字符串:"all","final","none"。它们设定有多少抽样性能度量被保存。allowParallel:逻辑变量,是否允许train函数使用并行处理(如果可能的话)。
还有其它选项在这没有讨论。
5.5.5 Alternate Performance Metrics
用户可以改变决定最佳设置的度量。默认的,回归使用RMSE和 R2 ,而分类使用准确率和Kappa统计量。回归和分类分别使用准确率和Kappa统计量选择参数值。train函数的metric参数允许用户选择哪种最优准则。例如,对于不平衡类的问题,用metric = "Kappa"来提高最中模型性能。
如果这些参数不理想,用户可以自定义性能度量。trainControl函数中有summaryFunction参数来设定计算性能的函数。这个函数应该有一下参数:
* data:数据框或矩阵的参考表,列包含观测值obs和预测结果pred。现在,类概率没法传递到这个函数中去。数据中是调参组合的预测值。如果trainControl函数中的classProbs参数设定为TRUE,在data中就会加入一列包含类概率的值。这些列名与类水平一样。另外,如果train函数中设定了weights,那么在数据集中就会再加一列weights的值。
* lev:是一个字符串,它有训练集中的输出因子水平。对于回归来说,NULL值会传递到这额函数。
* model:应用模型的字符串,(例如传递到train函数的参数method中去的值)。
函数的输出应该是一个没有空名的数值度量向量。默认为,train函数从预测类的及角度评估分类模型。另外,类概率也能用于性能测量。为了获得重抽样中预测的类概率,trainControl函数中的参数classProbs必须设定为TRUE。这会将概率值加入到每次抽样产生的预测中去。
在最后一节展示出,自定义函数能用于计算性能的平均得分。另一个内置函数twoClassFunction将会计算敏感度,特异性和ROC曲线下的面积。
head(twoClassSummary)

##
## 1 function (data, lev = NULL, model = NULL)
## 2 {
## 3     lvls <- levels(data$obs)
## 4     if (length(lvls) > 2)
## 5         stop(paste("Your outcome has", length(lvls), "levels. The twoClassSummary() function isn't appropriate."))
## 6     requireNamespaceQuietStop("ModelMetrics")
为了使用这个准则重新建立boost tree模型,我们可以使用下面代码观察参数和ROC曲线下面积的关系:
fitControl <- trainControl(method = "repeatedcv",
                           number = 10,
                           repeats = 10,
                           ## Estimate class probabilities
                           classProbs = TRUE,
                           ## Evaluate performance using
                           ## the following function
                           summaryFunction = twoClassSummary)

set.seed(825)
gbmFit3 <- train(Class ~ ., data = training,
                 method = "gbm",
                 trControl = fitControl,
                 verbose = FALSE,
                 tuneGrid = gbmGrid,
                 ## Specify which metric to optimize
                 metric = "ROC")
gbmFit3
## Stochastic Gradient Boosting
##
## 157 samples
##  60 predictor
##   2 classes: 'M', 'R'
##
## No pre-processing
## Resampling: Cross-Validated (10 fold, repeated 10 times)
## Summary of sample sizes: 142, 142, 140, 142, 142, 141, ...
## Resampling results across tuning parameters:
##
##   interaction.depth  n.trees  ROC   Sens  Spec
##   1                    50     0.86  0.80  0.70
##   1                   100     0.87  0.82  0.73
##   1                   150     0.87  0.83  0.75
##   1                   200     0.87  0.84  0.76
##   1                   250     0.88  0.84  0.76
##   1                   300     0.88  0.84  0.76
##   :                   :        :     :      :
##   9                  1350     0.89  0.87  0.76
##   9                  1400     0.89  0.87  0.77
##   9                  1450     0.89  0.87  0.77
##   9                  1500     0.89  0.87  0.77
##
## Tuning parameter 'shrinkage' was held constant at a value of 0.1
##
## Tuning parameter 'n.minobsinnode' was held constant at a value of 20
## ROC was used to select the optimal model using  the largest value.
## The final values used for the model were n.trees = 650,
##  interaction.depth = 5, shrinkage = 0.1 and n.minobsinnode = 20.
在这个案例中,最优参数的ROC曲线下的平均面积是0.896。
5.6 Choosing the Final Model
另一个自定义参数的过程就是修正用来选择最佳参数的算法。默认的,train函数选择具有最大性能值的模型,也可以使用其他模型的方案。Breiman等人建议简单的基于树的模型使用单个标准差规则。在这个案例中,识别了具有最佳性能值的模型,应用重抽样方法,我们能估计性能的标准误。最终的模型就是使用但标准差的最简单的模型。当基于树的模型刚开始出现过拟合,后来越来越适应模型的时候,这是有意义的。
train函数允许用户设定选取最终的的规则。参数selectionFunction用来提供能决定最终模型的函数。包中有三个函数:best选择最大或最小值,oneSE试图捕获Breiman等人的观点,tolerance选择具有一定最佳值忍耐度的最简单的模型。详情请看best。
只要拥有以下参数,用户也能自定义函数:
x是一个数据框,包括调整参数和与他们相关联的性能度量。每一行对应一个不同参数的组合。metric字符向量,指定那个性能度量应被优化(可以直接传递到train函数)。maximize逻辑值,表明一个性能度量的更大的值是否更好(可以直接传递到train函数)。
函数应该输出一个整数值,表明x的哪一行被选择。
作为一个例子,如果我们选择先前基于准确率的boost树模型,我们会选择:n.tree = 650,interaction.depth = 5, shrinkage = 0.1, n.minobsinnode = 20。然而,这张图中的刻度非常紧密,准确率在0.859至0.896之间。一个更简单的模型也可能有这样的准确率。
忍耐函数可以使用 (x−xbest)/xbest×100 来找出一个更简单的函数。例如,选择一个基于2%的性能损失的参数值。
whichTwoPct <- tolerance(gbmFit3$results, metric = "ROC",
                         tol = 2, maximize = TRUE)
cat("best model within 2 pct of best:\n")
## best model within 2 pct of best:
gbmFit3$results[whichTwoPct,1:6]
##    shrinkage interaction.depth n.minobsinnode n.trees       ROC      Sens
## 31       0.1                 5             20      50 0.8809623 0.8348611
这表明我们能得到一个更简单的模型,和具有最佳值的ROC面积0.896相比,这个模型的ROC面积为0.881.
这些函数的主要问题是怎样对模型的复杂性排序。在一些案例中,这很简单(例如简单树模型,偏最小二乘),但是在这样的模型中,模型排序是主观的。例如,一个有100次迭代,树的深度为2的boost树模型比50次迭代,深度为8的boost树更复杂吗?依据顺序,包会做出一些选择。在boost树模型案例中,包认为增加迭代次数比增加树的深度计算更快,所以,模型是先按照迭代排序然后再按照树深度排序。查看更多例子请看best。
5.7 Extracting Predictions and Class Probabilities
先前所提到的,train函数产生的对象包括finalModel里的最优模型。通过这些对象能够作出预测。在一些例子中,像pls或gbm对象,额外的参数需要设定。trian的对象应用参数优化的结果对新样本进行预测。例如,如果用predict.gbm作出预测,用户将不得不直接设定树的个数(没有默认值)。对于二分类问题,函数预测值是一种概率的形式,所以额外的步骤是要把它转化为因子向量。predict.train会自动处理这些细节。
在R中,有很少的标准语句来进行模型的预测。例如,为了获得类概率,很多predict方法会有一个参数type,用它来设定生成类概率或类别。不同的包使用不同的type值,像prob,posterior,response,probability或raw。在另外一些案例中,可能使用另外一些语句。
对于predict.train函数,type只取两个值class和prob。例如:
predict(gbmFit3, newdata = head(testing))
## [1] R R R R M M
## Levels: M R
predict(gbmFit3, newdata = head(testing), type = "prob")
##              M            R
## 1 9.799645e-04 0.9990200355
## 2 1.825908e-04 0.9998174092
## 3 5.373401e-08 0.9999999463
## 4 1.693365e-03 0.9983066351
## 5 9.999348e-01 0.0000651877
## 6 9.862454e-01 0.0137546480
5.8 Exploring and Comparing Resampling Distributions
5.8.1 Within-Model
对于一个特定的模型,有很多lattice函数探索参数调整和重抽样结果的关系:
xyplot和stripplot用于画出重抽样统计量。hisstogram和densityplot用于查看参数调整的分布。
例如,下图创建了一个密度函数:
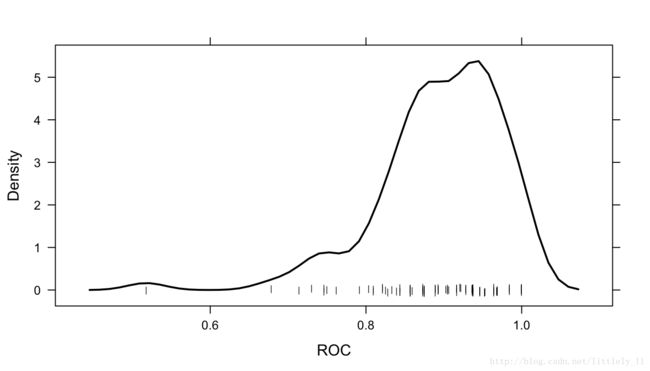
注意到,通过多个调整参数画出重抽样结果,如果你对这个感兴趣,那么resamples="all"应该放入控制选项中。
5.8.2 Between-Models
caret包包含一些函数,它可以通过重抽样分布把模型间的差别字符化。这些函数是基于Hothorn和Eugster等人的工作。
首先,用SVM模型拟合Sonar数据,数据通过preProc参数进行中心化和标准化。注意到随机数要先于模型设置,并且是和boost树模型使用的随机数是一样的。这保证抽到相同的样本,这对于我们比较两个模型有帮助。
set.seed(825)
svmFit <- train(Class ~ ., data = training,
                 method = "svmRadial",
                 trControl = fitControl,
                 preProc = c("center", "scale"),
                 tuneLength = 8,
                 metric = "ROC")
svmFit
## Support Vector Machines with Radial Basis Function Kernel
##
## 157 samples
##  60 predictor
##   2 classes: 'M', 'R'
##
## Pre-processing: centered (60), scaled (60)
## Resampling: Cross-Validated (10 fold, repeated 10 times)
## Summary of sample sizes: 142, 142, 140, 142, 142, 141, ...
## Resampling results across tuning parameters:
##
##   C      ROC        Sens       Spec
##    0.25  0.8672371  0.7413889  0.7466071
##    0.50  0.9030134  0.8326389  0.7794643
##    1.00  0.9221577  0.8700000  0.7748214
##    2.00  0.9318601  0.8902778  0.7714286
##    4.00  0.9373735  0.8881944  0.7998214
##    8.00  0.9442411  0.9061111  0.8125000
##   16.00  0.9445164  0.9173611  0.8126786
##   32.00  0.9445164  0.9123611  0.8166071
##
## Tuning parameter 'sigma' was held constant at a value of 0.0115025
## ROC was used to select the optimal model using  the largest value.
## The final values used for the model were sigma = 0.0115025 and C = 16.
正则判别分析模型拟合数据:
set.seed(825)
rdaFit <- train(Class ~ ., data = training,
                 method = "rda",
                 trControl = fitControl,
                 tuneLength = 4,
                 metric = "ROC")
rdaFit
## Regularized Discriminant Analysis
##
## 157 samples
##  60 predictor
##   2 classes: 'M', 'R'
##
## No pre-processing
## Resampling: Cross-Validated (10 fold, repeated 10 times)
## Summary of sample sizes: 142, 142, 140, 142, 142, 141, ...
## Resampling results across tuning parameters:
##
##   gamma      lambda     ROC        Sens       Spec
##   0.0000000  0.0000000  0.6768564  0.9244444  0.3951786
##   0.0000000  0.3333333  0.8356200  0.8441667  0.7278571
##   0.0000000  0.6666667  0.8578894  0.8248611  0.7798214
##   0.0000000  1.0000000  0.8487103  0.7754167  0.7653571
##   0.3333333  0.0000000  0.8934573  0.8688889  0.7478571
##   0.3333333  0.3333333  0.9130853  0.8987500  0.7803571
##   0.3333333  0.6666667  0.9079216  0.9109722  0.7692857
##   0.3333333  1.0000000  0.8667510  0.8304167  0.7760714
##   0.6666667  0.0000000  0.8856101  0.8704167  0.7326786
##   0.6666667  0.3333333  0.8935640  0.8920833  0.7289286
##   0.6666667  0.6666667  0.8869692  0.8833333  0.7416071
##   0.6666667  1.0000000  0.8560020  0.7868056  0.7728571
##   1.0000000  0.0000000  0.7192237  0.6590278  0.6460714
##   1.0000000  0.3333333  0.7215253  0.6591667  0.6487500
##   1.0000000  0.6666667  0.7226687  0.6615278  0.6487500
##   1.0000000  1.0000000  0.7242485  0.6661111  0.6462500
##
## ROC was used to select the optimal model using  the largest value.
## The final values used for the model were gamma = 0.3333333 and lambda
## = 0.3333333.给出这些模型,我们能做出判断谁的性能比较好吗?我们首先用resamples收集重抽样结果。
resamps <- resamples(list(GBM = gbmFit3,
                          SVM = svmFit,
                          RDA = rdaFit))
resamps
##
## Call:
## resamples.default(x = list(GBM = gbmFit3, SVM = svmFit, RDA = rdaFit))
##
## Models: GBM, SVM, RDA
## Number of resamples: 100
## Performance metrics: ROC, Sens, Spec
## Time estimates for: everything, final model fit
summary(resamps)
##
## Call:
## summary.resamples(object = resamps)
##
## Models: GBM, SVM, RDA
## Number of resamples: 100
##
## ROC
##       Min. 1st Qu. Median   Mean 3rd Qu. Max. NA's
## GBM 0.5179  0.8571 0.9048 0.8956  0.9479    1    0
## SVM 0.6786  0.9107 0.9557 0.9445  0.9844    1    0
## RDA 0.6032  0.8750 0.9219 0.9131  0.9643    1    0
##
## Sens
##      Min. 1st Qu. Median   Mean 3rd Qu. Max. NA's
## GBM 0.625  0.7778 0.8750 0.8679       1    1    0
## SVM 0.500  0.8750 0.8889 0.9174       1    1    0
## RDA 0.625  0.8750 0.8889 0.8988       1    1    0
##
## Spec
##       Min. 1st Qu. Median   Mean 3rd Qu. Max. NA's
## GBM 0.2857  0.7143 0.7500 0.7664  0.8571    1    0
## SVM 0.2857  0.7143 0.8571 0.8127  1.0000    1    0
## RDA 0.2857 0.7143 0.7500 0.7804 0.8571 1 0注意到,在这个例子中,选项resamples = "final"应该由用户自定义。
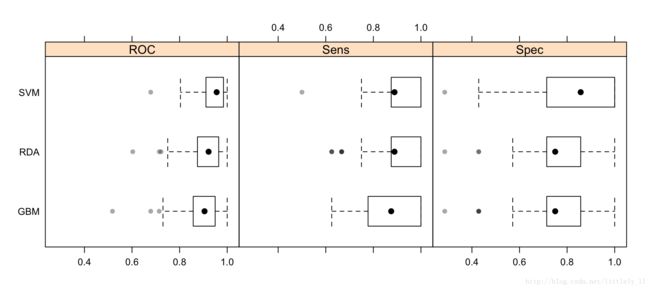
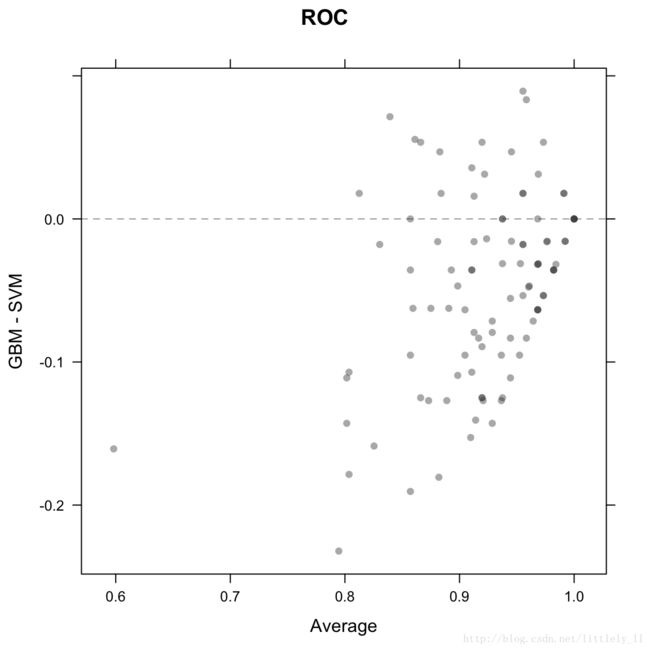
有很多lattice作图方法用于重抽样分布的可视化:density plots,box-whiker plots, scatterplot matrices和scatterplots of summary statistics.例如:
trellis.par.set(theme1)
bwplot(resamps, layout = c(3, 1))trellis.par.set(caretTheme())
dotplot(resamps, metric = "ROC")trellis.par.set(theme1)
xyplot(resamps, what = "BlandAltman")splom(resamps)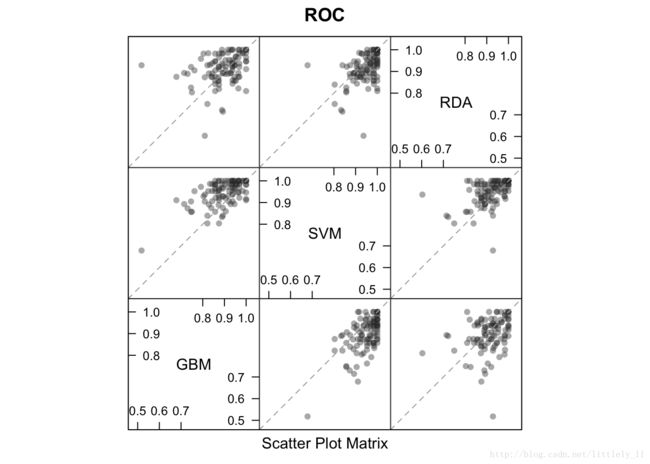
也可以应用像densityplot.resamples和parallel.resamples的可视化。
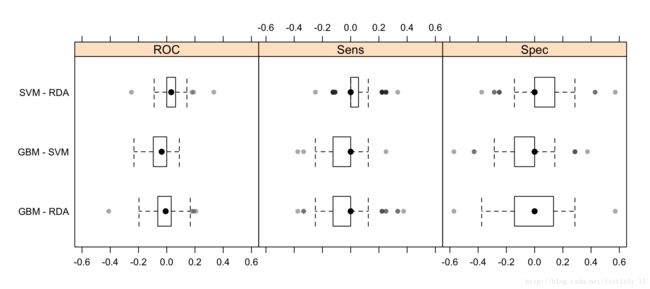
由于模型拟合相同的数据,所以比较模型的差异显得有意义。这样,我们减少可能存在的重抽样的相关性,计算差异,然后用t检验来检验模型是否有差异。
difValues <- diff(resamps)
difValues
##
## Call:
## diff.resamples(x = resamps)
##
## Models: GBM, SVM, RDA
## Metrics: ROC, Sens, Spec
## Number of differences: 3
## p-value adjustment: bonferroni
summary(difValues)
##
## Call:
## summary.diff.resamples(object = difValues)
##
## p-value adjustment: bonferroni
## Upper diagonal: estimates of the difference
## Lower diagonal: p-value for H0: difference = 0
##
## ROC
##     GBM       SVM       RDA
## GBM           -0.04896  -0.01753
## SVM 1.168e-10            0.03143
## RDA 0.1616    3.835e-05
##
## Sens
##     GBM       SVM       RDA
## GBM           -0.04944  -0.03083
## SVM 0.0002316            0.01861
## RDA 0.1244317 0.3697745
##
## Spec
##     GBM     SVM      RDA
## GBM         -0.04625 -0.01393
## SVM 0.01577           0.03232
## RDA 1.00000 0.13861
trellis.par.set(theme1)
bwplot(difValues, layout = c(3, 1))trellis.par.set(caretTheme())
dotplot(difValues)5.9 Fitting Models Without Parameter Tuning
在模型参数值已知的例子中,train函数可以对整个训练集拟合模型而不用重抽样或调整参数。可以使用trainControl的method = "none".例如:
fitControl <- trainControl(method = "none", classProbs = TRUE)

set.seed(825)
gbmFit4 <- train(Class ~ ., data = training,
                 method = "gbm",
                 trControl = fitControl,
                 verbose = FALSE,
                 ## Only a single model can be passed to the
                 ## function when no resampling is used:
                 tuneGrid = data.frame(interaction.depth = 4,
                                       n.trees = 100,
                                       shrinkage = .1,
                                       n.minobsinnode = 20),
                 metric = "ROC")
gbmFit4
## Stochastic Gradient Boosting
##
## 157 samples
##  60 predictor
##   2 classes: 'M', 'R'
##
## No pre-processing
## Resampling: None注意到plot.train,resamples,confusionMatrix.train和其他一些函数不能和这个gbmFit4对象一起使用,但是predict.train可以:
predict(gbmFit4, newdata = head(testing))
## [1] R R R R M M
## Levels: M R
predict(gbmFit4, newdata = head(testing), type = "prob")
##            M          R
## 1 0.07043641 0.92956359
## 2 0.02921858 0.97078142
## 3 0.01156062 0.98843938
## 4 0.36436834 0.63563166
## 5 0.92596513 0.07403487
## 6 0.82897570 0.17102430