用户流失预警—机器学习分类简单案例分析
该案例主要目的:根据用户一系列属性,对用户是否流失做出合理判断
1.读取数据
from __future__ import division
import pandas as pd
import numpy as np
#读取数据
churn_df = pd.read_csv('churn.csv')
col_names = churn_df.columns.tolist()
#打印列名
print("Column names:")
print(col_names)
#显示左边五列和右边五列数据
to_show = col_names[:6] + col_names[-6:]
#打印前六行
print("\nSample data:")
churn_df[to_show].head(6)
2.数据预处理
#将最后一列标签字段(字符型)数据类型转化为数值型
churn_result = churn_df['Churn?']
y = np.where(churn_result == 'True.',1,0)
# 删除无用字段
to_drop = ['State','Area Code','Phone','Churn?']
churn_feat_space = churn_df.drop(to_drop,axis=1)
# 将"Int'l Plan"和"VMail Plan" 两列转化为数值型
yes_no_cols = ["Int'l Plan","VMail Plan"]
churn_feat_space[yes_no_cols] = churn_feat_space[yes_no_cols] == 'yes'
# 所有属性字段名
features = churn_feat_space.columns
X = churn_feat_space.values.astype(np.float)
# 数据标准化
from sklearn.preprocessing import StandardScaler
scaler = StandardScaler()
X = scaler.fit_transform(X)
#显示记录数量和特征数量值
print('Feature space holds {} observations and {} features'.format( X.shape[0], X.shape[1]))
print("Unique target labels:", np.unique(y))
print(X[0])
print (len(y[y == 0]))
3.训练集的交叉验证
from sklearn.sklearn.model_selection import KFold

def run_cv(X,y,clf_class,**kwargs):
    # 创建一个kfolds对象
    kf = KFold(len(y),n_folds=5,shuffle=True)
    y_pred = y.copy()
    # 对训练集进行交叉验证
    for train_index, test_index in kf.split(X)::
        X_train, X_test = X[train_index], X[test_index]
        y_train = y[train_index]
        # 初始化带有参数的分类器
        clf = clf_class(**kwargs)
        clf.fit(X_train,y_train)
        y_pred[test_index] = clf.predict(X_test)
    return y_pred
4.分类模型构建—比较k近邻、随机森林和支持向量机三个模型
from sklearn.svm import SVC
from sklearn.ensemble import RandomForestClassifier as RF
from sklearn.neighbors import KNeighborsClassifier as KNN

def accuracy(y_true,y_pred):
    # NumPy 可以将boolean类型(True and False)分别转化为 1. 和 0.,返回统计指标——精度值
    return np.mean(y_true == y_pred)
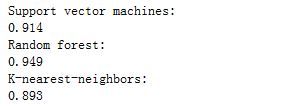
print ('Support vector machines:')
print ("%.3f" % accuracy(y, run_cv(X,y,SVC)))
print ("Random forest:")
print ("%.3f" % accuracy(y, run_cv(X,y,RF)))
print ("K-nearest-neighbors:")
print ("%.3f" % accuracy(y, run_cv(X,y,KNN)))
5.模型评价
通过函数predict_proba 计算分类器的正确率,根据predict_proba,我们分析不同阈值下的正确率分数,会发现在某些阈值下,正确率分数会更高。
def run_prob_cv(X, y, clf_class, **kwargs):
    kf = KFold(n_splits = 5, shuffle = True)
    y_prob = np.zeros((len(y),2))
    for train_index, test_index in kf.split(X):
        X_train, X_test = X[train_index], X[test_index]
        y_train = y[train_index]
        clf = clf_class(**kwargs)
        clf.fit(X_train,y_train)
        # 预测分类概率
        #predict_proba返回的是一个 n 行 k 列的数组, 第 i 行 第 j 列上的数值是模型预测 第 i 个预测样本为某个标签的概率,并且每一行的概率和为1。
        y_prob[test_index] = clf.predict_proba(X_test)
    return y_prob

import warnings
warnings.filterwarnings('ignore')

# Use 10 estimators so predictions are all multiples of 0.1
pred_prob = run_prob_cv(X, y, RF, n_estimators=10)
#print pred_prob[0]
pred_churn = pred_prob[:,1]
is_churn = y == 1

# Number of times a predicted probability is assigned to an observation
counts = pd.value_counts(pred_churn)
#print counts

# 计算概率值
true_prob = {}
for prob in counts.index:
    true_prob[prob] = np.mean(is_churn[pred_churn == prob])
    true_prob = pd.Series(true_prob)

# pandas-fu
counts = pd.concat([counts,true_prob], axis=1).reset_index()
counts.columns = ['pred_prob', 'count', 'true_prob']
counts
6.计算混淆矩阵并可视化
import matplotlib.pyplot as plt
from sklearn.metrics import confusion_matrix
from sklearn.utils.multiclass import unique_labels

def plot_confusion_matrix(y_true, y_pred, classes,
                          normalize=False,
                          title=None,
                          cmap=plt.cm.Blues):
    # 计算混淆矩阵
    cm = confusion_matrix(y_true, y_pred)
    # 仅适用标签列
    classes = classes[unique_labels(y_true, y_pred)]
    if normalize:
        cm = cm.astype('float') / cm.sum(axis=1)[:, np.newaxis]
        print("Normalized confusion matrix")
    else:
        print('Confusion matrix, without normalization')

    print(cm)

    fig, ax = plt.subplots()
    im = ax.imshow(cm, interpolation='nearest', cmap=cmap)
    ax.figure.colorbar(im, ax=ax)
    # 显示横坐标与纵坐标标签
    ax.set(xticks=np.arange(cm.shape[1]),
           yticks=np.arange(cm.shape[0]),
           xticklabels=classes, yticklabels=classes,
           title=title,
           ylabel='True label',
           xlabel='Predicted label')

    # 旋转坐标标签注释
    plt.setp(ax.get_xticklabels(), rotation=45, ha="right",
             rotation_mode="anchor")

    # 设置文本标签的格式
    fmt = '.2f' if normalize else 'd'
    thresh = cm.max() / 2.
    for i in range(cm.shape[0]):
        for j in range(cm.shape[1]):
            ax.text(j, i, format(cm[i, j], fmt),
                    ha="center", va="center",
                    color="white" if cm[i, j] > thresh else "black")
    fig.tight_layout()
    return ax

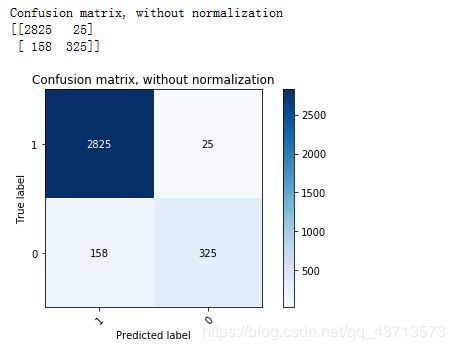
plot_confusion_matrix(y, run_cv(X, y, RF), classes=np.array([1, 0]),
                      title='Confusion matrix, without normalization')
plt.show()
参考网站:https://scikit-learn.org/stable/auto_examples/model_selection/plot_confusion_matrix.html#sphx-glr-auto-examples-model-selection-plot-confusion-matrix-py
案例资料下载地址:
链接:https://pan.baidu.com/s/1sHsIet6e7KCU6o7cme8JjQ
提取码:4ya3


