D3 二维图表的绘制系列(八)曲线图
上一篇: 堆叠面积图 https://blog.csdn.net/zjw_python/article/details/98214359
下一篇: 基础饼图 https://blog.csdn.net/zjw_python/article/details/98201470
代码结构和初始化画布的Chart对象介绍,请先看 https://blog.csdn.net/zjw_python/article/details/98182540
本图完整的源码地址: https://github.com/zjw666/D3_demo/tree/master/src/lineChart/smoothLineChart
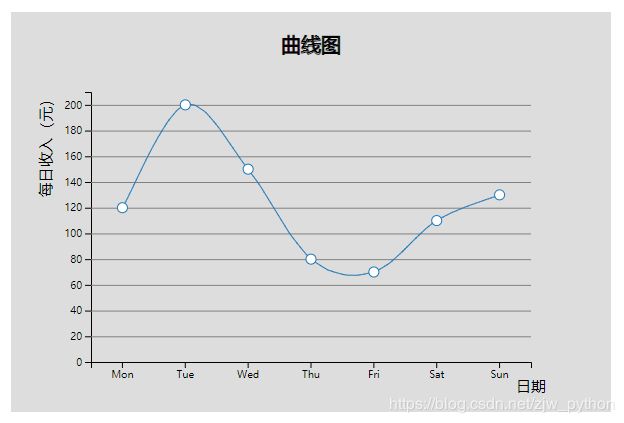
1 图表效果
2 数据
date,money
Mon,120
Tue,200
Wed,150
Thu,80
Fri,70
Sat,110
Sun,130
3 关键代码
导入数据为对象数组
d3.csv('./data.csv', function(d){
    return {
        date: d.date,
        money: +d.money
    };
}).then(function(data){
....
一些样式配置参数,与基础折线图类似
const config = {
        lineColor: chart._colors(0),
        margins: {top: 80, left: 80, bottom: 50, right: 80},
        textColor: 'black',
        gridColor: 'gray',
        ShowGridX: [],
        ShowGridY: [20, 40, 60, 80, 100, 120, 140, 160 ,180, 200, 220],
        title: '曲线图',
        pointSize: 5,
        pointColor: 'white',
        hoverColor: 'red',
        animateDuration: 1000
    }
尺度转换,具有X和Y轴
    /* ----------------------------尺度转换------------------------  */
    chart.scaleX = d3.scaleBand()
                    .domain(data.map((d) => d.date))
                    .range([0, chart.getBodyWidth()])

    chart.scaleY = d3.scaleLinear()
                    .domain([0, (Math.floor(d3.max(data, (d) => d.money)/10) + 1)*10])
                    .range([chart.getBodyHeight(), 0])
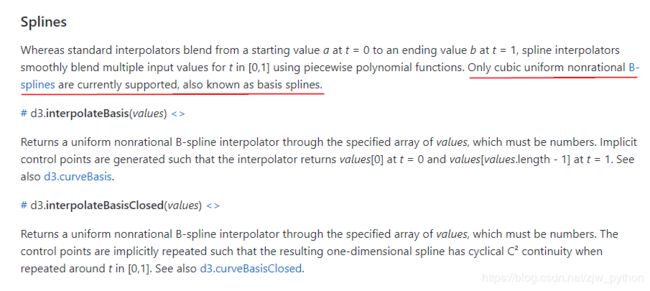
渲染线条,在基础折线图中,两点之间的连线为直线,为了达到画线的动画效果,直接对数据点进行线性插值,然后运用中间帧函数实现,曲线图的画线动画也是这个思路,不过区别在于由于两点之间的点是曲线,因此不能再直接应用线性插值,而是应该使用曲线插值。在D3中插值中,目前只支持B样条曲线的插值,而这种曲线插值并没有经过数据点,不满足我们的需求。三次样条曲线插值的方法有很多,例如有三次自然样条曲线、Hermite样条曲线、Cardinal样条曲线等介绍,我们这里运用Cardinal样条曲线插值法,计算曲线分段函数的系数。

插值算法参照这里修改
//对于给定点集points和张力tension, 进行cardinal样条曲线插值, 返回基于x坐标的插值函数
function cardinalSpline(points, tension){

    const controlPoints = addControlPoints(points);

    const pointsNum = controlPoints.length;

    if ( pointsNum < 4) return;

    const m =  getCardinalMatrix(tension);

    return function(x){

        //当x等于控制点的x值时,直接返回对应的控制点坐标
        if (x <= controlPoints[0].x) return [controlPoints[0].x, controlPoints[0].y];

        if (x >= controlPoints[pointsNum-1].x) return  [controlPoints[pointsNum-1].x, controlPoints[pointsNum-1].y];

        //遍历控制点,找到x所在区间对应的4个控制点,计算返回相应的插值点
        for (let i=1; i < pointsNum-2; i++){
            if (controlPoints[i].x < x && controlPoints[i+1].x > x){
                return [
                    compute(m, controlPoints[i-1].x, controlPoints[i].x, controlPoints[i+1].x, controlPoints[i+2].x, (x-controlPoints[i].x)/(controlPoints[i+1].x-controlPoints[i].x)),
                    compute(m, controlPoints[i-1].y, controlPoints[i].y, controlPoints[i+1].y, controlPoints[i+2].y, (x-controlPoints[i].x)/(controlPoints[i+1].x-controlPoints[i].x)),
                ]
            }else if (controlPoints[i+1].x === x){
                return [x, controlPoints[i+1].y];
            }
        }
    }

}

//返回m矩阵
function getCardinalMatrix(t){
    return [
        -t, 2-t, t-2, t,
        2*t, t-3, 3-2*t, -t,
        -t, 0, t, 0,
        0, 1, 0, 0
    ]
}

//计算x分量或y分量
function compute(m, p0, p1, p2, p3, u){
    const a = m[0]*p0 + m[1]*p1 + m[2]*p2 + m[3]*p3;
    const b = m[4]*p0 + m[5]*p1 + m[6]*p2 + m[7]*p3;
    const c = m[8]*p0 + m[9]*p1 + m[10]*p2 + m[11]*p3;
    const d = m[12]*p0 + m[13]*p1 + m[14]*p2 + m[15]*p3;

    return a*Math.pow(u,3) + b*Math.pow(u,2) + c*u + d; //三次曲线函数
}

//左右各增加两个虚拟的控制点,保证控制点数量大于等于4
function addControlPoints(points){
    const newPoints = []

    points.forEach((point) => {
        newPoints.push(point);
    })

    newPoints.unshift(points[0]);
    newPoints.push(points[points.length-1]);

    return newPoints;
}

export default cardinalSpline;
有了插值算法后,曲线图和基础折线图就几乎没有什么差别了
/* ----------------------------渲染线条------------------------  */
    chart.renderLines = function(){

        let lines = chart.body().selectAll('.line')
                    .data([data]);

            lines.enter()
                    .append('path')
                    .classed('line', true)
                .merge(lines)
                    .attr('fill', 'none')
                    .attr('stroke', config.lineColor)
                    .attr('transform', 'translate(' + chart.scaleX.bandwidth()/2 +',0)')
                    .transition().duration(config.animateDuration)
                    .attrTween('d', lineTween);

            lines.exit()
                    .remove();

            //中间帧函数
            function lineTween(){
                const generateLine = d3.line()
                                        .x((d) => d[0])
                                        .y((d) => d[1])
                                        .curve(d3.curveCardinal.tension(0.5));

                const inputPoints = data.map((d) => ({x: chart.scaleX(d.date), y: chart.scaleY(d.money)}));

                const interpolate = getInterpolate(inputPoints);    //根据输入点集获取对应的插值函数

                const outputPonits = []

                return function(t){
                    outputPonits.push(interpolate(t));
                    return generateLine(outputPonits);
                }
            }

            //点插值
            function getInterpolate(points){

                const domain = d3.range(0, 1, 1/(points.length-1));
                domain.push(1);

                const carInterpolate = cardinalSpline(points, 0.5);

                const scaleTtoX = d3.scaleLinear()   //时间t与x坐标的对应关系
                                        .domain(domain)
                                        .range(points.map((item) => item.x));

                return function(t){
                    return carInterpolate(scaleTtoX(t));
                }

            }
    }
线画好后,就是添加数据圆点、坐标轴和文本标签等,一样的老套路
/* ----------------------------渲染点------------------------  */
    chart.renderPonits = function(){
        let ponits = chart.body().selectAll('.point')
                    .data(data);

            ponits.enter()
                    .append('circle')
                    .classed('point', true)
                .merge(ponits)
                    .attr('cx', (d) => chart.scaleX(d.date))
                    .attr('cy', (d) => chart.scaleY(d.money))
                    .attr('r', 0)
                    .attr('fill', config.pointColor)
                    .attr('stroke', config.lineColor)
                    .attr('transform', 'translate(' + chart.scaleX.bandwidth()/2 +',0)')
                    .transition().duration(config.animateDuration)
                    .attr('r', config.pointSize);
    }

    /* ----------------------------渲染坐标轴------------------------  */
    chart.renderX = function(){
        chart.svg().insert('g','.body')
                .attr('transform', 'translate(' + chart.bodyX() + ',' + (chart.bodyY() + chart.getBodyHeight()) + ')')
                .attr('class', 'xAxis')
                .call(d3.axisBottom(chart.scaleX));
    }

    chart.renderY = function(){
        chart.svg().insert('g','.body')
                .attr('transform', 'translate(' + chart.bodyX() + ',' + chart.bodyY() + ')')
                .attr('class', 'yAxis')
                .call(d3.axisLeft(chart.scaleY));
    }

    chart.renderAxis = function(){
        chart.renderX();
        chart.renderY();
    }

    /* ----------------------------渲染文本标签------------------------  */
    chart.renderText = function(){
        d3.select('.xAxis').append('text')
                            .attr('class', 'axisText')
                            .attr('x', chart.getBodyWidth())
                            .attr('y', 0)
                            .attr('fill', config.textColor)
                            .attr('dy', 30)
                            .text('日期');

        d3.select('.yAxis').append('text')
                            .attr('class', 'axisText')
                            .attr('x', 0)
                            .attr('y', 0)
                            .attr('fill', config.textColor)
                            .attr('transform', 'rotate(-90)')
                            .attr('dy', -40)
                            .attr('text-anchor','end')
                            .text('每日收入(元)');
    }

    /* ----------------------------渲染网格线------------------------  */
    chart.renderGrid = function(){
        d3.selectAll('.yAxis .tick')
            .each(function(d, i){
                if (config.ShowGridY.indexOf(d) > -1){
                    d3.select(this).append('line')
                        .attr('class','grid')
                        .attr('stroke', config.gridColor)
                        .attr('x1', 0)
                        .attr('y1', 0)
                        .attr('x2', chart.getBodyWidth())
                        .attr('y2', 0);
                }
            });

        d3.selectAll('.xAxis .tick')
            .each(function(d, i){
                if (config.ShowGridX.indexOf(d) > -1){
                    d3.select(this).append('line')
                        .attr('class','grid')
                        .attr('stroke', config.gridColor)
                        .attr('x1', 0)
                        .attr('y1', 0)
                        .attr('x2', 0)
                        .attr('y2', -chart.getBodyHeight());
                }
            });
    }
最后绑定鼠标交互事件
/* ----------------------------绑定鼠标交互事件------------------------  */
    chart.addMouseOn = function(){
        //防抖函数
        function debounce(fn, time){
            let timeId = null;
            return function(){
                const context = this;
                const event = d3.event;
                timeId && clearTimeout(timeId)
                timeId = setTimeout(function(){
                    d3.event = event;
                    fn.apply(context, arguments);
                }, time);
            }
        }

        d3.selectAll('.point')
            .on('mouseover', function(d){
                const e = d3.event;
                const position = d3.mouse(chart.svg().node());
                e.target.style.cursor = 'hand'

                d3.select(e.target)
                    .attr('fill', config.hoverColor);

                chart.svg()
                    .append('text')
                    .classed('tip', true)
                    .attr('x', position[0]+5)
                    .attr('y', position[1])
                    .attr('fill', config.textColor)
                    .text('收入:' + d.money);
            })
            .on('mouseleave', function(){
                const e = d3.event;

                d3.select(e.target)
                    .attr('fill', config.pointColor);

                d3.select('.tip').remove();
            })
            .on('mousemove', debounce(function(){
                    const position = d3.mouse(chart.svg().node());
                    d3.select('.tip')
                    .attr('x', position[0]+5)
                    .attr('y', position[1]-5);
                }, 6)
            );
    }
大功告成!!!
![]()
