今天想和大家讨论的问题是:飞机航行距离和延误时间有没有关系呢?我们的数据是R 中nycflights13包的航班数据。好了,搬好小板凳,我们要开始分析了。
先简单了解下我们的数据
> install.packages("dplyr")       #安装数据处理包
> install.packages("nycflights13")   #安装数据包
> library(dplyr)       #载入安装的数据处理包
> library(nycflights13)     #载入安装的数据包
> flights
# A tibble: 336,776 x 19
    year month   day dep_time sched_dep_time dep_delay arr_time sched_arr_time

 1  2013     1     1      517            515         2      830            819
 2  2013     1     1      533            529         4      850            830
 3  2013     1     1      542            540         2      923            850
 4  2013     1     1      544            545        -1     1004           1022
 5  2013     1     1      554            600        -6      812            837
 6  2013     1     1      554            558        -4      740            728
 7  2013     1     1      555            600        -5      913            854
 8  2013     1     1      557            600        -3      709            723
 9  2013     1     1      557            600        -3      838            846
10  2013     1     1      558            600        -2      753            745
# ... with 336,766 more rows, and 11 more variables: arr_delay , carrier ,
#   flight , tailnum , origin , dest , air_time ,
#   distance , hour , minute , time_hour
观察运行的程序能够得知所要分析的数据有336776行19列,包括航班日期:year,month、day;起飞延迟时间:dep_delay(以分为单位);到达延迟时间:arr_delay(分);航行距离:distance(英里);目的地:dest等数据。其实那么多数据,只选择足够分析问题的数据就好了。
数据处理
数据处理之前,再看下分析目标:航班距离和到达延误时间的关系。
与分析目标相关的字段有:包括航班日期:year,month、day;起飞延迟时间:dep_delay(单位:分);到达延迟时间:arr_delay(单位:分);航行距离:distance(单位:英里);目的地:dest。
- 选择子集(与目标相关的字段)
> myflight<-select(flights,year,month,day,dep_delay,arr_delay,distance,dest)
> myflight
# A tibble: 336,776 x 7
    year month   day dep_delay arr_delay distance  dest

 1  2013     1     1         2        11     1400   IAH
 2  2013     1     1         4        20     1416   IAH
 3  2013     1     1         2        33     1089   MIA
 4  2013     1     1        -1       -18     1576   BQN
 5  2013     1     1        -6       -25      762   ATL
 6  2013     1     1        -4        12      719   ORD
 7  2013     1     1        -5        19     1065   FLL
 8  2013     1     1        -3       -14      229   IAD
 9  2013     1     1        -3        -8      944   MCO
10  2013     1     1        -2         8      733   ORD
# ... with 336,766 more rows
select用法延伸:
- select(数据集,字段1,字段2,......),其中字段前为正值表示保留变量,负值表示删除变量。
- select(数据集,(字段1:字段n)),表示能够把字段1和字段n之间的字段都能筛选出来。
- select(数据集,starts_with("a")),表示筛选以"a"开始的字段;select(数据集,ends_with("a")),表示筛选以"a"结束的字段;select(数据集,contains("a")),表示筛选包含"a"的字段;
- 进行列名重命名
> myflight<-rename(myflight,destination=dest)
> myflight
# A tibble: 336,776 x 7
    year month   day dep_delay arr_delay distance destination

 1  2013     1     1         2        11     1400         IAH
 2  2013     1     1         4        20     1416         IAH
 3  2013     1     1         2        33     1089         MIA
 4  2013     1     1        -1       -18     1576         BQN
 5  2013     1     1        -6       -25      762         ATL
 6  2013     1     1        -4        12      719         ORD
 7  2013     1     1        -5        19     1065         FLL
 8  2013     1     1        -3       -14      229         IAD
 9  2013     1     1        -3        -8      944         MCO
10  2013     1     1        -2         8      733         ORD
# ... with 336,766 more rows
- 删除缺失值
考虑到因为天气等原因航班会有取消的情况,所以延误时间就会存在有空值,这时为保证数据分析的质量,需要删除缺失值。使用 filter(): subsets your data by keeping rows that meet specified conditions,表示筛选出符合条件的行。
> myflight<-filter(myflight,!is.na(dep_delay),!is.na(arr_delay))
> myflight
# A tibble: 327,346 x 7
year month   day dep_delay arr_delay distance destination

1  2013     1     1         2        11     1400         IAH
 2  2013     1     1         4        20     1416         IAH
 3  2013     1     1         2        33     1089         MIA
 4  2013     1     1        -1       -18     1576         BQN
 5  2013     1     1        -6       -25      762         ATL
 6  2013     1     1        -4        12      719         ORD
 7  2013     1     1        -5        19     1065         FLL
 8  2013     1     1        -3       -14      229         IAD
 9  2013     1     1        -3        -8      944         MCO
10  2013     1     1        -2         8      733         ORD
# ... with 327,336 more rows
    1     1        -2         8      733         ORD
    # ... with 336,766 more rows
处理前有336776行,处理后有327346行,所以缺失值为 9430。
延伸,查找某些特些特定的值
#查找日期为12月25日的数据情况
filter(myFlight,month==12,day==25)  #查找12月25日的航班情况,注意用的是"=="
#查找延误时间(包括起飞和到达两种情况)大于2小时的数据情况
filter(myFlight,arr_delay>120 | dep_delay>120)
- 数据的排序
这里为了演示下arrange()函数的用法
  myFlight<-arrange(myFlight,dep_delay)#按照升序排序
  myFlight<-arrange(myFlight,desc(dep_delay))#按照降序排序
数据的预处理结束,下面开始数据的计算
数据的计算
一切都是套路,数据计算的套路:数据拆分,函数应用,组合结果(Split-Apply-Combine)
- 数据拆分
用group_by()函数进行分组,在这里将选择以目的地进行分组
> by_dest<-group_by(myflight,destination)
> by_dest
# A tibble: 327,346 x 7
# Groups:   destination [104]
    year month   day dep_delay arr_delay distance destination

 1  2013    12     7       -43        48     1626         DEN
 2  2013     2     3       -33       -58     1183         MSY
 3  2013    11    10       -32       -10      229         IAD
 4  2013     1    11       -30       -10     1010         TPA
 5  2013     1    29       -27       -10     1620         DEN
 6  2013     8     9       -26         7      502         DTW
 7  2013    10    23       -25         0      631         TYS
 8  2013     3    30       -25       -37      502         DTW
 9  2013     3     2       -24       -30      301         BUF
10  2013     5     5       -24       -44     1076         FLL
# ... with 327,336 more rows
- 按照分组,利用函数进行组合
> delay<-summarise(by_dest,count=n(),mean(distance,na.rm = TRUE),mean(arr_delay,na.rm=TRUE),encoding = "UTF-8")
> delay
# A tibble: 104 x 5
   destination count `mean(distance, na.rm = TRUE)` `mean(arr_delay, na.rm = TRUE)`

 1         ABQ   254                      1826.0000                        4.381890
 2         ACK   264                       199.0000                        4.852273
 3         ALB   418                       143.0000                       14.397129
 4         ANC     8                      3370.0000                       -2.500000
 5         ATL 16837                       757.1383                       11.300113
 6         AUS  2411                      1514.2522                        6.019909
 7         AVL   261                       583.6130                        8.003831
 8         BDL   412                       116.0000                        7.048544
 9         BGR   358                       378.0000                        8.027933
10         BHM   269                       865.9963                       16.877323
# ... with 94 more rows, and 1 more variables: encoding
- 删除噪音值
对于飞往目的地数量少于20的数据,我们选择删除,不做参考
现在我们能够得知所要分析的数据有336,776行19列

> delay<-filter(delay,count>20)
> delay
# A tibble: 97 x 5
   destination count `mean(distance, na.rm = TRUE)` `mean(arr_delay, na.rm = TRUE)`

 1         ABQ   254                      1826.0000                        4.381890
 2         ACK   264                       199.0000                        4.852273
 3         ALB   418                       143.0000                       14.397129
 4         ATL 16837                       757.1383                       11.300113
 5         AUS  2411                      1514.2522                        6.019909
 6         AVL   261                       583.6130                        8.003831
 7         BDL   412                       116.0000                        7.048544
 8         BGR   358                       378.0000                        8.027933
 9         BHM   269                       865.9963                       16.877323
10         BNA  6084                       758.2206                       11.812459
# ... with 87 more rows, and 1 more variables: encoding
- 简化数据计算
The %>% operator:In the dplyr syntax, we “chain” commands together using the %>% operator. We use the %>% operator to connect one command to another. The output of one command becomes the input for the next command.简单解释下,"%>%"的作用是连接两个命令,并且上一个命令的输出是下一个命令的输入。
> delay<-myflight%>%group_by(destination)%>%summarise(count=n(),dist=mean(distance,na.rm = TRUE),dela=mean(arr_delay,na.rm=TRUE))%>%filter(count>20)%>%arrange(count)
> delay
# A tibble: 97 x 4
   destination count      dist       dela

 1         JAC    21 1875.9048 28.0952381
 2         BZN    35 1882.0000  7.6000000
 3         CHO    46  305.0000  9.5000000
 4         MYR    58  550.6724  4.6034483
 5         TVC    95  652.4526 12.9684211
 6         CAE   106  603.6981 41.7641509
 7         ILM   107  500.0000  4.6355140
 8         CRW   134  444.0000 14.6716418
 9         EGE   207 1735.8019  6.3043478
10         MVY   210  173.0000 -0.2857143
# ... with 87 more rows
数据可视化
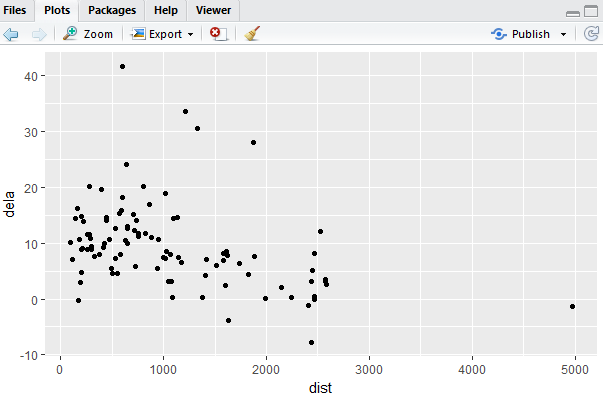
选择用视图更加直观的说明数据的意义,使用ggplot2包。
 > install.packages("ggplot2")
 > library(ggplot2)
1.先创建画板
> ggplot(data=delay)
2.添加点图层
> ggplot(data=delay)+geom_point(mapping = aes(x=dist,y=dela));
3.添加平滑曲线图层
> ggplot(data=delay)+geom_point(mapping = aes(x=dist,y=dela))+geom_smooth(mapping = aes(x=dist,y=dela))
结论
飞行距离在1000英里以内,延迟时间多为20分钟以内,且延迟分布还比较均匀。飞行距离在1000英里以后,延迟时间会大多为10分钟以内。


