图像分割+连通域统计与标注——MATLAB
图像分割+连通域统计与标注
例一
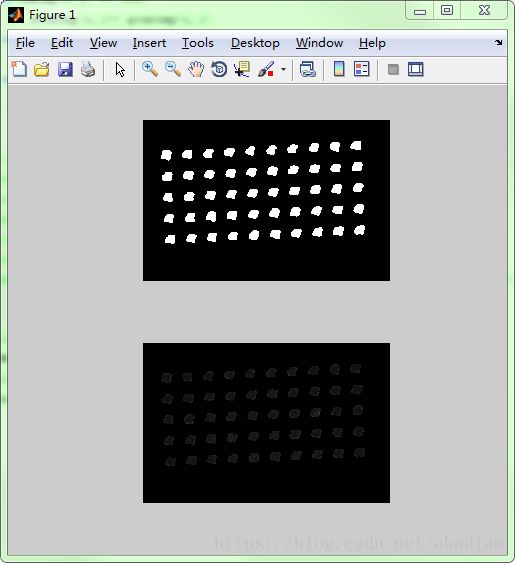
如图,对下列光斑图像进行分割,将光斑目标分割出来,并计算光斑数量。
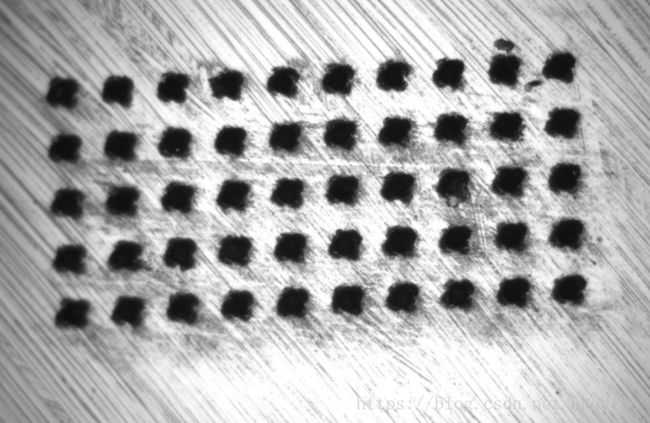
图像分割
先将图像二值化,然后做形态学处理获得目标所在区域,然后分割图像。
MATLAB代码:
%框选统计光斑
clear;
%读取原图像
img=imread('01.png');
grayimg = rgb2gray(img);
BWimg = grayimg;
[width,height]=size(grayimg);

%二值化
T1=40;
for i=1:width
    for j=1:height
if(grayimg(i,j)连通域统计标注
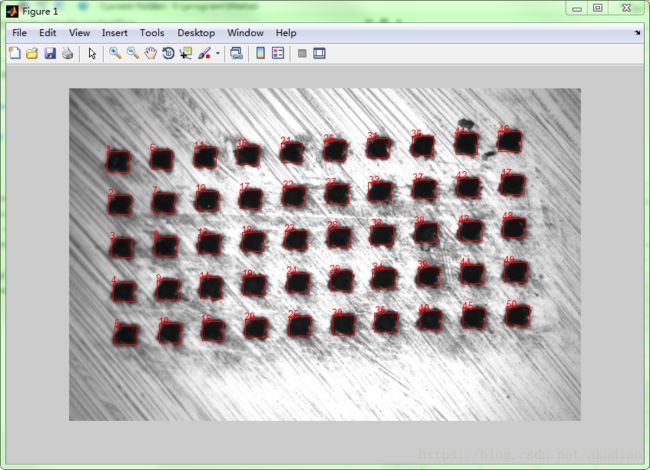
先将图像二值化,然后做形态学处理,最后使用外接矩形框选连通域,并使用形心确定连通域位置。
MATLAB代码:
%框选统计光斑
clear;
img=imread('01.png'); %读取原图像
grayimg = rgb2gray(img);
BWimg = grayimg;
[width,height]=size(grayimg);

%二值化
T1=40;
for i=1:width
    for j=1:height
if(grayimg(i,j)例二
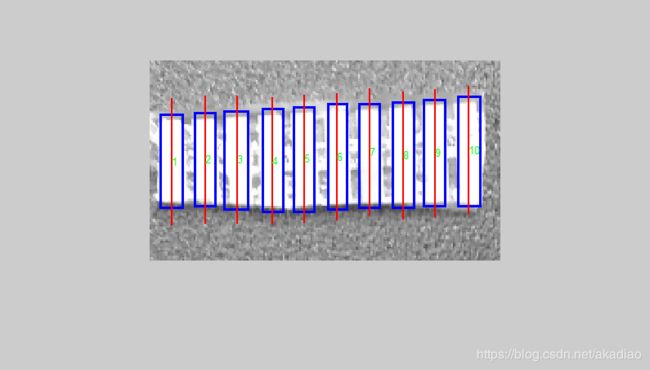
如图,编程实现石英玻璃微通道图像的分割,将微通道从背景中分割出来,分割后,提取每个通道的中心线。
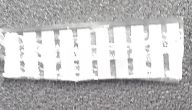
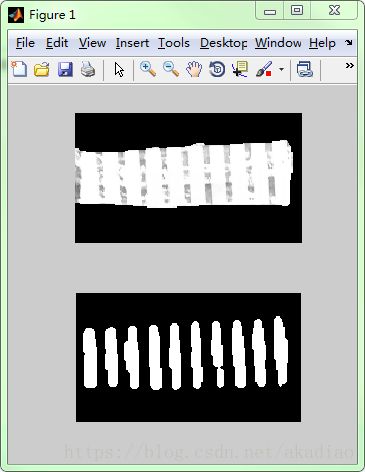
先将图像二值化,然后做形态学处理,再使用外接矩形框选连通域,并使用形心确定连通域的中心线位置。
MATLAB代码:
% 分离
clear;
img=imread('00.png');
grayimg = rgb2gray(img);
BWimg = grayimg;
[width,height]=size(grayimg);

%二值化
T1=230;
for i=1:width
    for j=1:height
        if(grayimg(i,j) > T1)
            BWimg(i,j)= 255;
        else
            BWimg(i,j)= 0;
        end
    end
end

se=strel('disk',8);
BWimg = imclose(BWimg,se);
se=strel('disk',5);
BWimg = imopen(BWimg,se);

showImg = grayimg;
for i=1:width
    for j=1:height
        if(BWimg(i,j) == 255)
            showImg(i,j)= grayimg(i,j);
        else
            showImg(i,j)= 0;
        end
    end
end

%分离出目标区域
T1=250;
for i=1:width
    for j=1:height
        if(showImg(i,j) > T1)
            BWimg(i,j)= 255;
        else
            BWimg(i,j)= 0;
        end
    end
end

%先开操作,再做特定方向的腐蚀与膨胀
se=strel('disk',5);
BWimg = imopen(BWimg,se);
se= strel('line',9,90);
BWimg = imdilate(BWimg,se);

se= strel('line',5,0);
BWimg = imerode(BWimg,se);

%使用外接矩形框选连通域,并使用形心确定连通域的中心线位置
[l,m] = bwlabel(BWimg);
status=regionprops(l,'BoundingBox');
centroid = regionprops(l,'Centroid');

imshow(grayimg);
hold on;
for i=1:m
    rectangle('position',status(i).BoundingBox,'edgecolor','b', 'LineWidth',2.5);
    line([centroid(i,1).Centroid(1,1), centroid(i,1).Centroid(1,1)],[centroid(i,1).Centroid(1,2)-35, centroid(i,1).Centroid(1,2)+35],'Color','r', 'LineWidth',2);
    text(centroid(i,1).Centroid(1,1),centroid(i,1).Centroid(1,2), num2str(i),'Color', 'g');
end

%分割目标区域
% subplot(2,1,1);imshow(showImg);
% subplot(2,1,2);imshow(BWimg);
输出:
