文章目录
- 决策树、随机森林——泰坦尼克号生死预测示例
- 1. 导包
- 2. 原始数据
- 3. 数据预处理
- 4. 使用决策树
- 4.1 构建决策树模型
- 4.2 结果预测与评估
- 4.3 画学习曲线
- 5. 使用随机森林
- 5.1 构建随机森林模型
- 5.2 结果预测与评估
- 5.3 利用网格搜索和交叉验证
决策树、随机森林——泰坦尼克号生死预测示例
1. 导包
import pandas as pd
from sklearn.feature_extraction import DictVectorizer
from sklearn.model_selection import train_test_split
from sklearn.tree import DecisionTreeClassifier, export_graphviz
from sklearn.ensemble import RandomForestClassifier
from sklearn.model_selection import GridSearchCV
import graphviz
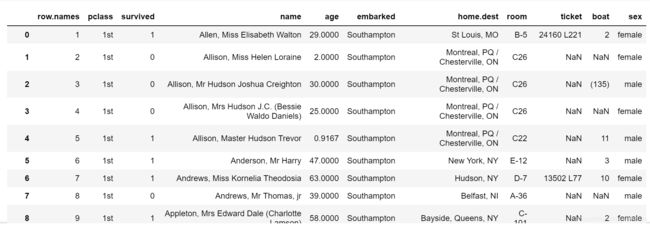
2. 原始数据
titanic = pd.read_csv("http://biostat.mc.vanderbilt.edu/wiki/pub/Main/DataSets/titanic.txt")
titanic

3. 数据预处理
X = titanic[["pclass", "age", "sex"]]
y = titanic["survived"]
print(X)
X["age"].fillna(X["age"].mean(), inplace=True)
X_train, X_test, y_train, y_test = train_test_split(X, y, train_size=0.75)
dict = DictVectorizer(sparse=False)
X_train = dict.fit_transform(X_train.to_dict(orient="records"))
X_test = dict.transform(X_test.to_dict(orient="records"))
print(dict.get_feature_names())
print(X_train)
4. 使用决策树
4.1 构建决策树模型
dtf = DecisionTreeClassifier(criterion="entropy", max_depth=5, min_samples_split=3, min_samples_leaf=1)
dtf.fit(X_train, y_train)
4.2 结果预测与评估
print("实际:", y_test)
print("预测:", clf.predict(X_test))
print(dtf.score(X_test, y_test))
dot_data = export_graphviz(
dtf,
feature_names=['age', 'pclass=1st', 'pclass=2nd', 'pclass=3rd', 'sex=female', 'sex=male'],
class_names=["生", "死"],
filled=True,
rounded=True
)
graph = graphviz.Source(dot_data)
graph
4.3 画学习曲线
import matplotlib.pyplot as plt

scores = []
for i in range(10):
    clf = tree.DecisionTreeClassifier(criterion="entropy", max_depth=i+1, min_samples_split=3, min_samples_leaf=1, random_state=10)
    clf.fit(X_train, y_train)
    score = clf.score(X_test, y_test)
    scores.append(score)

plt.plot(range(1,11), scores, color='b', label='max_depth')
plt.legend()
plt.show()
5. 使用随机森林
5.1 构建随机森林模型
srfc = RandomForestClassifier(n_estimators=200, max_depth=5)
srfc.fit(X_train, y_train)
5.2 结果预测与评估
print(srfc.score(X_test, y_test))
print(srfc.predict(X_test)[0:10])
print(y_test[0:10])
5.3 利用网格搜索和交叉验证
rfc = RandomForestClassifier()
param_grid = {
"n_estimators": [120, 200, 360, 450, 500],
"max_depth": [5, 9, 18, 27, 36]
}
gscv = GridSearchCV(rfc, param_grid=param_grid, cv=5)
gscv.fit(X_train, y_train)
print(gscv.score(X_test, y_test))
print(gscv.best_params_)


