springboot干货——自定义健康检查指标
springboot——汇总篇
前言
在系统运行过程中我们需要监控系统运行是否正常,而有时因为系统或者需求的特殊之处,我们需要自定义相关健康指标用以监测我们的系统。本篇博客主要带大家了解下相关内容,不做深入探讨,有兴趣的可以百度。
健康检查有两种方式查看,一种是http,另一种是JMX,http方式很好理解,JMX一般可以用jdk的bin目录下的jconsole工具
YES表示默认使用,NO表示默认不使用,N/A表示不支持
JMX和Http不是互斥的关系,是两种访问途径
端点
| ID | JMX | Http |
| auditevents | Yes | No |
| beans | Yes | No |
| caches | Yes | No |
| conditions | Yes | No |
| configprops | Yes | No |
| env | Yes | No |
| flyway | Yes | No |
| health | Yes | Yes |
| heapdump | N/A | No |
| httptrace | Yes | No |
| info | Yes | Yes |
| integrationgraph | Yes | No |
| jolokia | N/A | No |
| logfile | N/A | No |
| loggers | Yes | No |
| liquibase | Yes | No |
| metrics | Yes | No |
| mappings | Yes | No |
| prometheus | N/A | No |
| scheduledtasks | Yes | No |
| sessions | Yes | No |
| shutdown(默认不开启) | Yes | No |
| threaddump | Yes | No |
1.开启指定endpoint
此处的${id}代表上述的真实id
management.endpoint.${id}.enabled
一般只需要开启shutdown(其他都是默认开启的)
management.endpoint.shutdown.enabled=true
2.关闭所有endpoint
这个一般和上面搭配使用,来自定义端点的开启
management.endpoints.enabled-by-default=false修改暴露端点
| Property | Default |
| management.endpoints.jmx.exposure.exclude | |
| management.endpoints.jmx.exposure.include | * |
| management.endpoints.web.exposure.exclude | |
| management.endpoints.web.exposure.include | info, health |
include属性列出暴露端点的IDS,exclude属性列出不应该暴露端点的IDS;exclude属性的优先级高于include属性,include和exclude属性都可以使用端点列表来配置IDS.
1.JMX只公开部分端点
停止公开所有在JMX上公开的端点,只公开info和health两个端点
management.endpoints.jmx.exposure.include=health,info
2.HTTP公开部分之外的所有端点
* 可以用来表示所有的端点,例如,通过HTTP公开所有的端点,除了env和beans端点
management.endpoints.web.exposure.include=*
management.endpoints.web.exposure.exclude=env,beans
3.注意
* 在YAML中有特殊的含义,所以如果想使用include或者exclude包含所有的端点时要加上双引号
management:
  endpoints:
    web:
      exposure:
        include: "*"
代码
1.pom.xml
在一般的pom文件中加入如下依赖即可
			org.springframework.boot
			spring-boot-starter-actuator
2.application.properties
spring.jpa.hibernate.ddl-auto=none
spring.jpa.properties.hibernate.show_sql=true
spring.jpa.properties.hibernate.format_sql=true
management.endpoints.web.exposure.include=*
#展示细节,除了always之外还有when-authorized、never,默认值是never
management.endpoint.health.show-details=always
#设置端口号,如果不希望通过HTTP公开端点,则可以将管理端口设置为-1
#management.server.port=-1
management.server.port=8081
#修改访问地址
management.server.address=127.0.1.1
#修改端点的前缀,将/actuator/{id}更改为/manage/{id}
management.endpoints.web.base-path=/manage
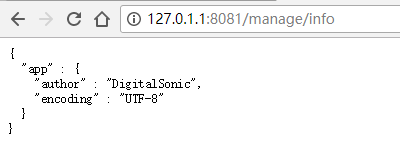
#/actuator/info中相关信息
info.app.author=DigitalSonic
[email protected]@
3.自定义健康检查逻辑
具体service的代码我就不贴出来了,具体的逻辑看具体业务,这边只是去数据库查询数据,对于其他业务没有任何意义
import geektime.spring.springbucks.waiter.service.CoffeeService;
import org.springframework.beans.factory.annotation.Autowired;
import org.springframework.boot.actuate.health.Health;
import org.springframework.boot.actuate.health.HealthIndicator;
import org.springframework.stereotype.Component;

@Component
public class CoffeeIndicator implements HealthIndicator {
    @Autowired
    private CoffeeService coffeeService;

    @Override
    public Health health() {
        long count = coffeeService.getCoffeeCount();
        Health health;
        if (count > 0) {
            health = Health.up()
                    .withDetail("count", count)
                    .withDetail("message", "We have enough coffee.")
                    .build();
        } else {
            health = Health.down()
                    .withDetail("count", 0)
                    .withDetail("message", "We are out of coffee.")
                    .build();
        }
        return health;
    }
}
4.结果验证
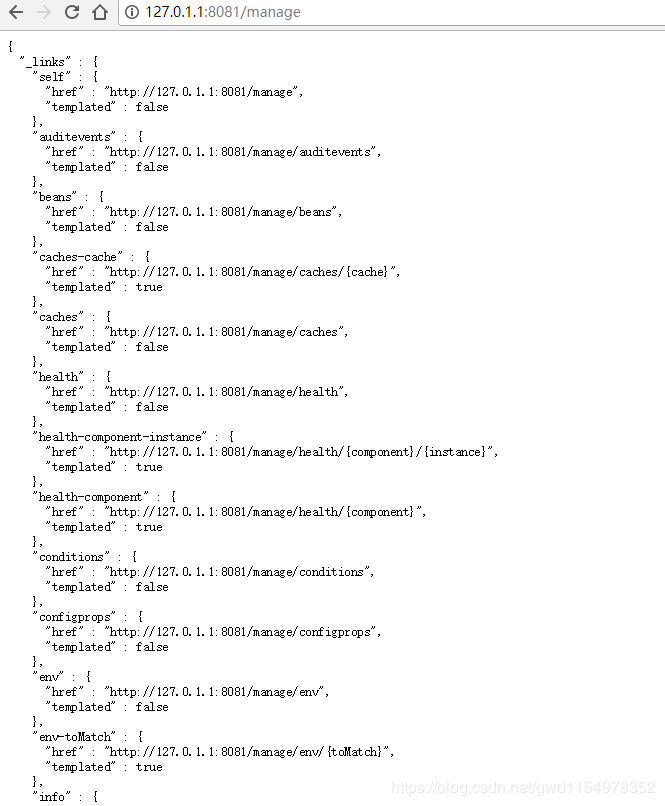
a.打开http://127.0.1.1:8081/manage显示如下
b.打开http://127.0.1.1:8081/manage/health显示如下
此处包含了我们自定义的健康检查

c.打开http://127.0.1.1:8081/manage/info显示info相关信息