【python数据可视化笔记】——matplotlib.pyplot()
目 录
- 1 %matplotlib inline
- 2 matplotlib图例中文乱码以及坐标负号显示
- 2.1 快速解决办法
- 2.2 永久解决办法
- 2.2.1 找到自己想要的中文字体
- 2.2.2 把字体复制到matplotlib的字体文件中
- 2.2.3 重新加载字体
- 2.2.4 删除matplotlib缓存文件
- 3 什么是plt、fig和ax
- 3.1 设置画布fig = plt.figure()
- 3.2 设置轴(子图)fig, ax = plt.subplots()
- 4 matplotlib.pyplot入门
- 4.1 数值
- 4.2 点的属性
- 4.3 线的属性
- 4.4 创建子图
- 4.4.1 subplot()
- 4.4.2 subplot2grid()
- 4.4.3 axes()
- 4.5 插入文字
- 4.5.1 注释文本
- 4.6 *非线性坐标轴
- 5 matplotlib.pyplot进阶
- 5.1 条形图/柱状图
- 5.2 直方图
- 5.3 散点图
- 5.4 堆叠图
- 5.5 饼图
%matplotlib inline
这是一个魔法函数(只能在ipython和jupyter环境下使用),使用%matplotlib命令可以将matplotlib的图表直接嵌入到Notebook之中,或者使用指定的界面库显示图表,它有一个参数指定matplotlib图表的显示方式。inline表示将图表嵌入到Notebook中。可以试着运行一段生成图片的命令,如果前面没有这行代码,输出的是一个图片对象,需要重新运行该段程序才能正常显示,如果有这行代码第一次运行程序块就可以显示图片了。在使用jupyter时的用处不大,因为可以轻松地重复执行程序快。
import matplotlib.pyplot as plt

plt.figure()
plt.title("666")
plt.show()
plt.figure()
plt.title("666")
plt.show()
%matplotlib inline
import matplotlib.pyplot as plt

plt.figure()
plt.title("666")
plt.show()
matplotlib图例中文乱码以及坐标负号显示
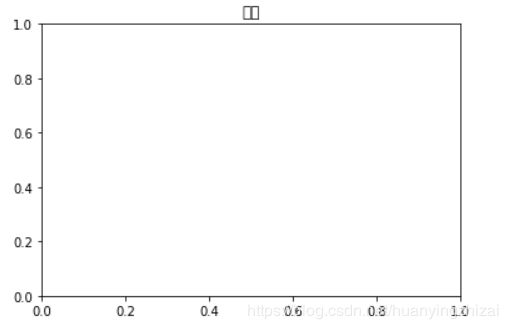
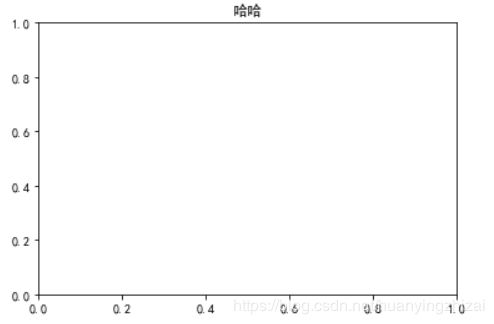
在图片的标签名,标题名或者图例中出现中文时,直接运行会出现乱码,文字显示为框框
import matplotlib.pyplot as plt

plt.figure()
plt.title("哈哈")
plt.show()
快速解决办法
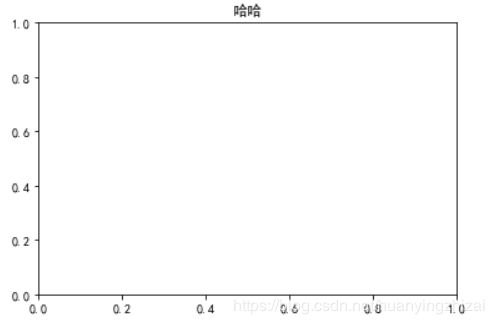
在导入模块后加入下面代码
plt.rcParams['font.sans-serif']=['SimHei']    # 用来正常显示中文标签
plt.rcParams['axes.unicode_minus']=False    # 用来正常显示负号
import matplotlib.pyplot as plt

plt.rcParams['font.sans-serif']=['SimHei']
plt.rcParams['axes.unicode_minus']=False

plt.figure()
plt.title("哈哈")
plt.show()
永久解决办法
找到自己想要的中文字体
-
在系统中查找已有的字体(好处是不需要安装):在“C:\Windows\Fonts”中选择后缀为“.ttf”的中文字体并复制,这一步我选择了黑体
-
在 fontpalace 上下载对应版本的后缀为“.ttf”的字体,复制到“C:\Windows\Fonts”中安装
把字体复制到matplotlib的字体文件中
输入下面命令找到matplotlib配置文件
print(matplotlib.matplotlib_fname())
在“c:\program files\python37\lib\site-packages\matplotlib\mpl-data\matplotlibrc”的“font/ttf”文件夹中粘贴刚刚复制的字体,然后修改配置文件matplotlibrc,去掉以下三行代码开头的#
font.family         : sans-serif

font.sans-serif     : SimHei, DejaVu Sans, Bitstream Vera Sans, ...    # 这里注意要把字体名称SimHei放在第一个

axes.unicode_minus  : False    # 修改为False,作用是解决负号的乱码问题
还要注意有的字体名称并不是字体文件的名称,可以查看字体文件的属性(标题)确认一下
重新加载字体
做完以上操作后执行下面命令
from matplotlib.font_manager import _rebuild

_rebuild()
之后重启python,很多时候这样就解决了。
删除matplotlib缓存文件
如果仍然不能正常显示输入以下代码
matplotlib.get_cachedir()
在’C:\Users\sunch\.matplotlib’找到缓存文件夹并删除该文件夹,之后重启python,如果还是不行可以试试重启电脑,我就是重启了才可以,果然没有什么是一次重启解决不了的,如果有那就两次
import matplotlib.pyplot as plt

plt.figure()
plt.title("哈哈")
plt.show()
什么是plt、fig和ax
这是我们看到作图程序中最常见的几个词。plt是matplotlib.pyplot的简称,我们一般都会用它来代替导入的模块;fig一般出现在
fig = plt.figure()这个命令中,是常用来表示当前画布的一个变量,虽然可以用别的但是大家一般都用fig(figure的缩写);ax一般和fig一起出现在fig, ax = plt.subplots()命令中,或者单独出现在ax = plt.subplot()命令中,表示当前画布的当前子图对象
设置画布fig = plt.figure()
plt.figure(num, figsize, dpi, facecolor, edgecolor, frameon, FigureClass, clear)的参数说明如下
| 参数名称 | 参数类型 | 参数说明 |
|---|---|---|
| num | integer or string | 画布的名称或序号,默认为从1开始的升序序列 |
| figsize | (float, float) | 画布尺寸,默认6.4 x 4.8 |
| dpi | integer | 分辨率,默认100 |
| facecolor | color spec | 背景色,默认白色(‘w’) |
| edgecolor | color spec | 边界色,默认白色(‘w’) |
| frameon | bool | 是否有边界,默认为True |
| FigureClass | subclass of Figure | 使用自定义的画布对象(没什么用的参数) |
| clear | bool | 是否对存在的画布进行清除,默认为False,即自动创建新画布 |
函数返回一个Figure对象,也就是fig,它有很多内置的属性和方法,比如set()方法,可以设置更多画布参数
我们也可以不设置fig变量,但是声明fig变量可以增强程序的可读性
import matplotlib.pyplot as plt

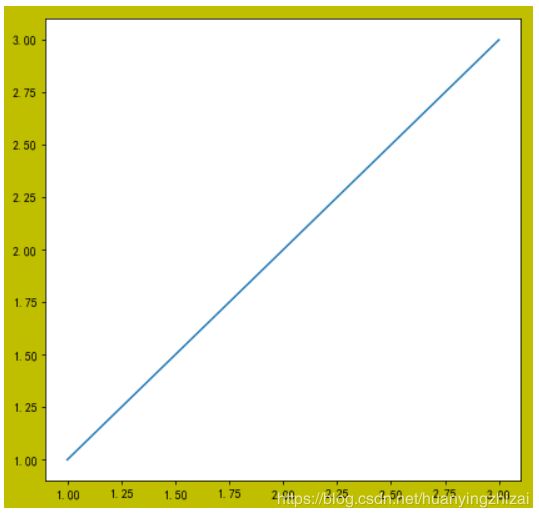
fig = plt.figure('lalala', figsize = (7, 7), dpi = 100, facecolor = 'y', edgecolor = 'r')
plt.plot([1, 2, 3], [1, 2, 3])
plt.show()
设置轴(子图)fig, ax = plt.subplots()
fig, ax = plt.subplots()等价于fig, ax = plt.subplots(11),注意这里的轴不是数学意义上的坐标轴,而是指子图的位置。plt.subplot()函数返回一个Figure对象和一个子图对象的列表:fig, axes = plt.subplots(23)即表示一次性在figure上创建成2*3的网格,然后指定子图的位置进行作图,同fig一样也可以省去对变量的声明,并且也可以直接设置类似figure()函数的参数
fig = plt.figure(figsize = (12, 7))
ax = plt.subplot(231)
ax = plt.subplot(232)
ax = plt.subplot(233)
ax = plt.subplot(234)
ax = plt.subplot(235)
ax = plt.subplot(236)
matplotlib.pyplot入门
官网1
官网2
数值
import matplotlib.pyplot as plt

plt.plot([1,2,3,4])
plt.ylabel('some numbers')
plt.show()

如果 p l o t ( ) plot() plot() 函数只传入一个列表,那么这个列表的值会默认为y轴的值,x轴会自动创建和列表对应的值,从0开始
import matplotlib.pyplot as plt

plt.plot([1, 2, 3, 4], [1, 4, 9, 16])
plt.show()
点的属性
p l o t ( ) plot() plot() 函数可以指定一个字符串参数来设置传入点的颜色和形状,如默认为" b − b- b−",其中 b b b 表示蓝色 − - − 表示折线,也可以指定为其他颜色和形状
import matplotlib.pyplot as plt

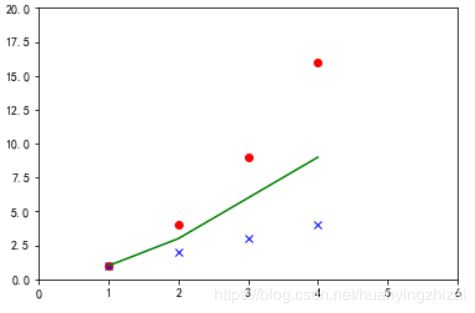
plt.plot([1,2,3,4], [1,4,9,16], 'ro')    # 红色圆点
plt.plot([1,2,3,4], [1,2,3,4], 'bx')   # 蓝色x点
plt.plot([1,2,3,4], [1,3,6,9], 'g-')    # 绿色折线

plt.axis([0, 6, 0, 20])    # 设置坐标轴的限制[xmin, xmax, ymin, ymax]
plt.show()
import numpy as np
import matplotlib.pyplot as plt

t = np.arange(0., 5., 0.2)

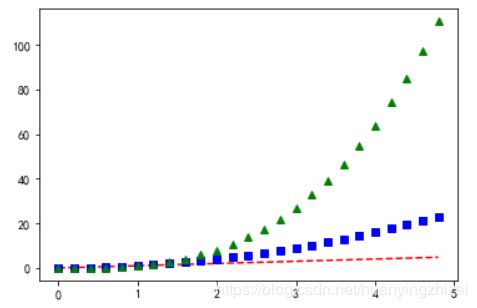
plt.plot(t, t, 'r--', t, t**2, 'bs', t, t**3, 'g^')    # 可以直接在一个函数中传入多个图像参数
plt.show()
更多关于 p l o t ( ) plot() plot() 的点的参数设置(如颜色和形状)查阅plot()
线的属性
下面看一下如何控制线的属性
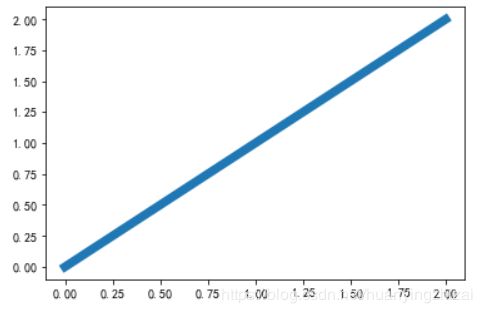
- 直接传入实参
import matplotlib.pyplot as plt

plt.plot(range(3), range(3), linewidth=7.0)
plt.show()
- 用Line2D对象的方法
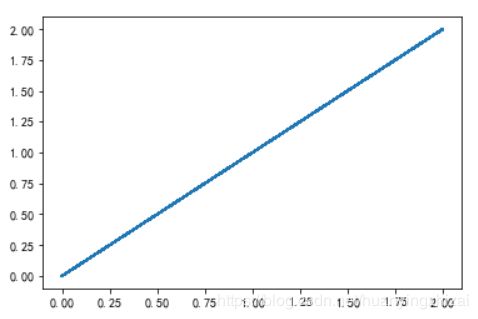
plot()返回一个Line2D对象的列表,如果想要对其中的某个线的属性进行控制,需要进行序列解包
import matplotlib.pyplot as plt

line, = plt.plot(range(3), range(3), '-')
line.set_antialiased(False)    # 关闭抗锯齿
plt.show()
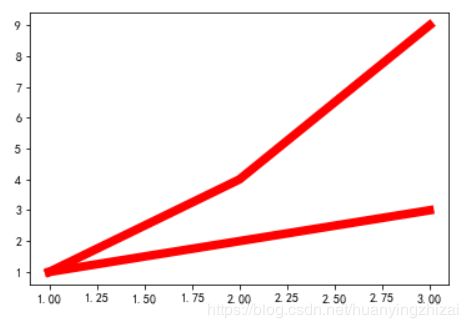
- 使用setp()命令设置多条属性

  可以直接使用setp()查看可以设置的属性
plt.setp(lines)
agg_filter: a filter function, which takes a (m, n, 3) float array and a dpi value, and returns a (m, n, 3) array
alpha: float
animated: bool
antialiased: bool
clip_box: .Bbox
clip_on: bool
clip_path: [(~matplotlib.path.Path, .Transform) | .Patch | None]
color: color
contains: callable
dash_capstyle: {‘butt’, ‘round’, ‘projecting’}
dash_joinstyle: {‘miter’, ‘round’, ‘bevel’}
dashes: sequence of floats (on/off ink in points) or (None, None)
drawstyle: {‘default’, ‘steps’, ‘steps-pre’, ‘steps-mid’, ‘steps-post’}
figure: .Figure
fillstyle: {‘full’, ‘left’, ‘right’, ‘bottom’, ‘top’, ‘none’}
gid: str
in_layout: bool
label: object
linestyle: {’-’, ‘–’, ‘-.’, ‘:’, ‘’, (offset, on-off-seq), …}
linewidth: float
marker: unknown
markeredgecolor: color
markeredgewidth: float
markerfacecolor: color
markerfacecoloralt: color
markersize: float
markevery: unknown
path_effects: .AbstractPathEffect
picker: float or callable[[Artist, Event], Tuple[bool, dict]]
pickradius: float
rasterized: bool or None
sketch_params: (scale: float, length: float, randomness: float)
snap: bool or None
solid_capstyle: {‘butt’, ‘round’, ‘projecting’}
solid_joinstyle: {‘miter’, ‘round’, ‘bevel’}
transform: matplotlib.transforms.Transform
url: str
visible: bool
xdata: 1D array
ydata: 1D array
zorder: float
关于线的更多属性查阅matplotlib.lines.Line2D
创建子图
每次画图时都会默认创建一个画布(figure(1))和子图位置(subplot(111)),为了创建子图,我们需要创建一个画布并给出每个子图的位置。
使用gcf()和gca()可以查看当前画布和子图位置
import matplotlib.pyplot as plt

print(plt.gcf())    # get current figure

print(plt.gca())    # get current axes
Figure(432x288)
AxesSubplot(0.125,0.125;0.775x0.755)
subplot()
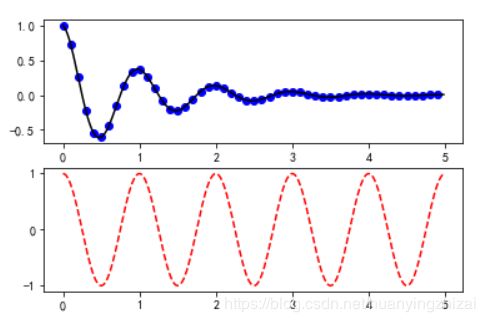
使用subplot()指定下一个子图的位置,标准写法为plt.subplot(nrows=r, ncols=c, index=i),当子图数量小于10时,可以简写为plt.subplot(rci)
import numpy as np
import matplotlib.pyplot as plt

def f(t):
    return np.exp(-t) * np.cos(2*np.pi*t)

t1 = np.arange(0.0, 5.0, 0.1)
t2 = np.arange(0.0, 5.0, 0.02)

plt.figure(1)    # 这个命令是可以省略的,因为会默认创建一个画布,1代表画布的序号
#print(plt.gcf())
plt.subplot(211)    # 指定为2行1列画布的第一个位置
#print(plt.gca())
plt.plot(t1, f(t1), 'bo', t2, f(t2), 'k')


plt.subplot(212)    # 指定为2行1列画布的第二个位置
#print(plt.gca())
plt.plot(t2, np.cos(2*np.pi*t2), 'r--')
plt.show()
Figure(432x288)
AxesSubplot(0.125,0.536818;0.775x0.343182)
AxesSubplot(0.125,0.125;0.775x0.343182)
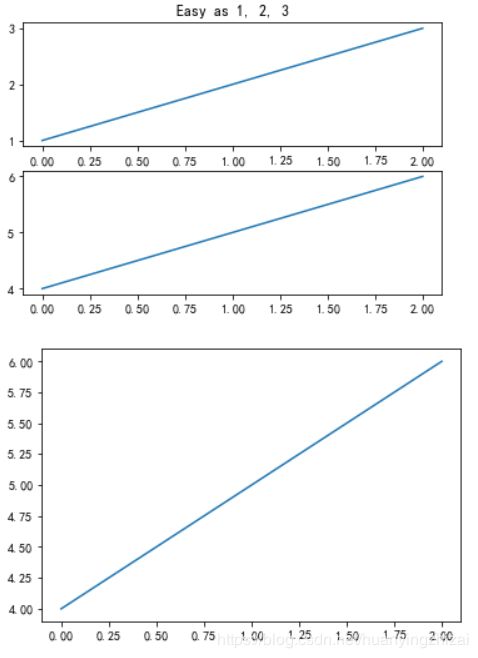
import matplotlib.pyplot as plt

# 第一块画布
plt.figure(1)
plt.subplot(211)
plt.plot([1, 2, 3])
plt.subplot(212)
plt.plot([4, 5, 6])

# 第二块画布
plt.figure(2)
plt.plot([4, 5, 6])

# 修改第一块画布
plt.figure(1)    # 指定画布序号
plt.subplot(211)    # 指定子图位置
plt.title('Easy as 1, 2, 3')    # 修改图片内容
plt.show()
"""Examples illustrating the use of plt.subplots().

This function creates a figure and a grid of subplots with a single call, while
providing reasonable control over how the individual plots are created.  For
very refined tuning of subplot creation, you can still use add_subplot()
directly on a new figure.
"""

import matplotlib.pyplot as plt
import numpy as np

# Simple data to display in various forms
x = np.linspace(0, 2 * np.pi, 400)
y = np.sin(x ** 2)

plt.close('all')

# Just a figure and one subplot
f, ax = plt.subplots()
ax.plot(x, y)
ax.set_title('Simple plot')

# Two subplots, the axes array is 1-d
f, axarr = plt.subplots(2, sharex=True)
axarr[0].plot(x, y)
axarr[0].set_title('Sharing X axis')
axarr[1].scatter(x, y)

# Two subplots, unpack the axes array immediately
f, (ax1, ax2) = plt.subplots(1, 2, sharey=True)
ax1.plot(x, y)
ax1.set_title('Sharing Y axis')
ax2.scatter(x, y)

# Three subplots sharing both x/y axes
f, (ax1, ax2, ax3) = plt.subplots(3, sharex=True, sharey=True)
ax1.plot(x, y)
ax1.set_title('Sharing both axes')
ax2.scatter(x, y)
ax3.scatter(x, 2 * y ** 2 - 1, color='r')
# Fine-tune figure; make subplots close to each other and hide x ticks for
# all but bottom plot.
f.subplots_adjust(hspace=0)
plt.setp([a.get_xticklabels() for a in f.axes[:-1]], visible=False)

# row and column sharing
f, ((ax1, ax2), (ax3, ax4)) = plt.subplots(2, 2, sharex='col', sharey='row')
ax1.plot(x, y)
ax1.set_title('Sharing x per column, y per row')
ax2.scatter(x, y)
ax3.scatter(x, 2 * y ** 2 - 1, color='r')
ax4.plot(x, 2 * y ** 2 - 1, color='r')

# Four axes, returned as a 2-d array
f, axarr = plt.subplots(2, 2)
axarr[0, 0].plot(x, y)
axarr[0, 0].set_title('Axis [0,0]')
axarr[0, 1].scatter(x, y)
axarr[0, 1].set_title('Axis [0,1]')
axarr[1, 0].plot(x, y ** 2)
axarr[1, 0].set_title('Axis [1,0]')
axarr[1, 1].scatter(x, y ** 2)
axarr[1, 1].set_title('Axis [1,1]')
# Fine-tune figure; hide x ticks for top plots and y ticks for right plots
plt.setp([a.get_xticklabels() for a in axarr[0, :]], visible=False)
plt.setp([a.get_yticklabels() for a in axarr[:, 1]], visible=False)

# Four polar axes
f, axarr = plt.subplots(2, 2, subplot_kw=dict(projection='polar'))
axarr[0, 0].plot(x, y)
axarr[0, 0].set_title('Axis [0,0]')
axarr[0, 1].scatter(x, y)
axarr[0, 1].set_title('Axis [0,1]')
axarr[1, 0].plot(x, y ** 2)
axarr[1, 0].set_title('Axis [1,0]')
axarr[1, 1].scatter(x, y ** 2)
axarr[1, 1].set_title('Axis [1,1]')
# Fine-tune figure; make subplots farther from each other.
f.subplots_adjust(hspace=0.3)

plt.show()
可以用命令clf()和cla()清除当前图片和轴,作用是清理内存。如果不是编写包含非常多图片的程序,该命令可以省略。
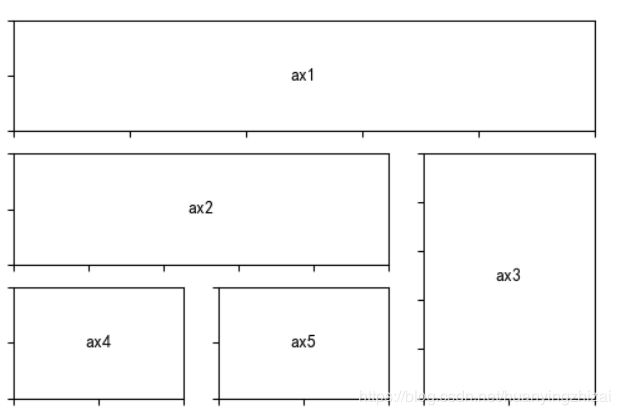
subplot2grid()
相比subplot()可以实现跨区域的子图,其参数如下:
| 参数名称 | 参数类型 | 参数说明 |
|---|---|---|
| shape | sequence of 2 ints | 子图的区域形状,如(x, y)表示x行y列的子区域 |
| loc | sequence of 2 ints | 子图开始的区域 |
| rowspan | int | 子图跨越的行数 |
| colspan | int | 子图跨越的列数 |
| fig | Figure, optional | 子图所在的画布,默认为当前画布 |
import matplotlib.pyplot as plt


def annotate_axes(fig):
    for i, ax in enumerate(fig.axes):
        ax.text(0.5, 0.5, "ax%d" % (i+1), va="center", ha="center")
        ax.tick_params(labelbottom=False, labelleft=False)


fig = plt.figure(dpi = 100)
ax1 = plt.subplot2grid((3, 3), (0, 0), colspan=3)
ax2 = plt.subplot2grid((3, 3), (1, 0), colspan=2)
ax3 = plt.subplot2grid((3, 3), (1, 2), rowspan=2)
ax4 = plt.subplot2grid((3, 3), (2, 0))
ax5 = plt.subplot2grid((3, 3), (2, 1))

annotate_axes(fig)

plt.show()
axes()
axes([left, bottom, width, height]) 可以指定子图的具体位置,其中每个参数都应该是[0, 1]上的数字。和subplot()不同的是,axes()是在主图上叠加其他的子图,主图可以有自己的内容,而subplot()是子图的并列,没有主图。
import matplotlib.pyplot as plt
import numpy as np

# create some data to use for the plot
dt = 0.001
t = np.arange(0.0, 10.0, dt)
r = np.exp(-t[:1000]/0.05)               # impulse response
x = np.random.randn(len(t))
s = np.convolve(x, r)[:len(x)]*dt  # colored noise

# the main axes is subplot(111) by default
plt.plot(t, s)
plt.axis([0, 1, 1.1*np.amin(s), 2*np.amax(s)])    # 指定坐标系的范围,相当于plt.xlim(0, 1); plt.ylim(1.1*np.amin(s), 2*np.amax(s))
plt.xlabel('time (s)')
plt.ylabel('current (nA)')
plt.title('Gaussian colored noise')

# this is an inset axes over the main axes
a = plt.axes([.65, .6, .2, .2], facecolor='y')
n, bins, patches = plt.hist(s, 400, density=1)
plt.title('Probability')
plt.xticks([])
plt.yticks([])

# this is another inset axes over the main axes
a = plt.axes([0.2, 0.6, .2, .2], facecolor='y')
plt.plot(t[:len(r)], r)
plt.title('Impulse response')
plt.xlim(0, 0.2)
plt.xticks([])
plt.yticks([])

plt.show()
插入文字
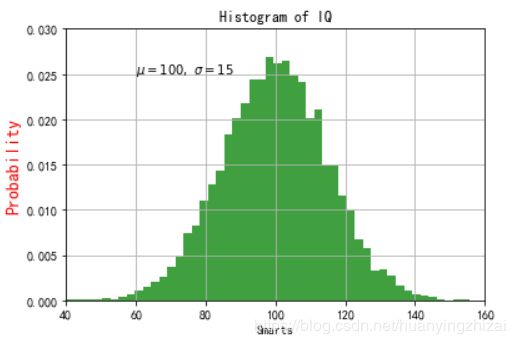
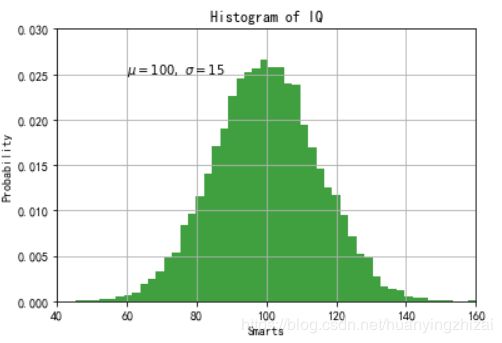
import numpy as np
import matplotlib.pyplot as plt

np.random.seed(20190522)

mu, sigma = 100, 15
x = mu + sigma * np.random.randn(10000)

# the histogram of the data
n, bins, patches = plt.hist(x, 50, density=1, facecolor='g', alpha=0.75)


plt.xlabel('Smarts')    # 横坐标标签
plt.ylabel('Probability', fontsize=14, color='red')    # 纵坐标标签并指定文字属性
plt.title('Histogram of IQ')    # 标题
plt.text(60, .025, r'$\mu=100,\ \sigma=15$')    # 指定位置插入文字,若无坐标则表示在当前范围内的比值,如(0.5, 0.5, 'xx')表示在中央插入xx
plt.axis([40, 160, 0, 0.03])
plt.grid(True)
plt.show()
更多文字的属性查阅Text properties and layout
更多Tex数学表达式的写法查阅Writing mathematical expressions
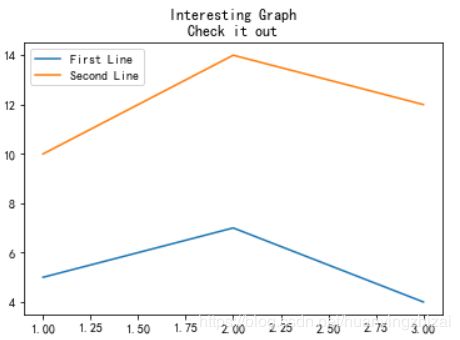
import matplotlib.pyplot as plt

x = [1,2,3]
y = [5,7,4]

x2 = [1,2,3]
y2 = [10,14,12]

plt.plot(x, y, label='First Line')    # 声明图例内容
plt.plot(x2, y2, label='Second Line')
plt.title('Interesting Graph\nCheck it out')
plt.legend()    # 插入图例
plt.show()
注释文本
使用annotate()可以实现一些更加高级的注释功能
import numpy as np
import matplotlib.pyplot as plt

ax = plt.subplot(111)

t = np.arange(0.0, 5.0, 0.01)
s = np.cos(2*np.pi*t)
line, = plt.plot(t, s, lw=2)

plt.annotate('local max', xy=(2, 1), xytext=(3, 1.5),
            arrowprops=dict(facecolor='black', shrink=0.05),
            )    # xy表示被注释点的位置,xytext表示注释文本的位置

plt.ylim(-2,2)
plt.show()
*非线性坐标轴
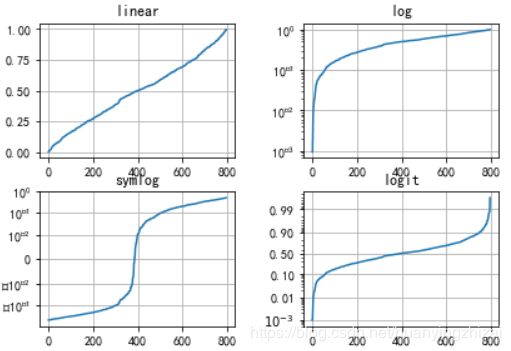
就是把y轴映射到另一种表达式如log(y)等,目的是使数据能展示的更全面。更多内容查阅creating scales and transformations
import numpy as np
import matplotlib.pyplot as plt

from matplotlib.ticker import NullFormatter  # useful for `logit` scale

# Fixing random state for reproducibility
np.random.seed(20190522)

# make up some data in the interval [0, 1]
y = np.random.normal(loc=0.5, scale=0.4, size=1000)
y = y[(y > 0) & (y < 1)]
y.sort()
x = np.arange(len(y))

# plot with various axes scales
plt.figure(1)

# linear
plt.subplot(221)
plt.plot(x, y)
plt.yscale('linear')
plt.title('linear')
plt.grid(True)


# log
plt.subplot(222)
plt.plot(x, y)
plt.yscale('log')    # 对数坐标轴
plt.title('log')
plt.grid(True)


# symmetric log
plt.subplot(223)
plt.plot(x, y - y.mean())
plt.yscale('symlog', linthreshy=0.01)
plt.title('symlog')
plt.grid(True)

# logit
plt.subplot(224)
plt.plot(x, y)
plt.yscale('logit')
plt.title('logit')
plt.grid(True)
# Format the minor tick labels of the y-axis into empty strings with
# `NullFormatter`, to avoid cumbering the axis with too many labels.
plt.gca().yaxis.set_minor_formatter(NullFormatter())
# Adjust the subplot layout, because the logit one may take more space
# than usual, due to y-tick labels like "1 - 10^{-3}"
plt.subplots_adjust(top=0.92, bottom=0.08, left=0.10, right=0.95, hspace=0.25,
                    wspace=0.35)

plt.show()
matplotlib.pyplot进阶
条形图/柱状图
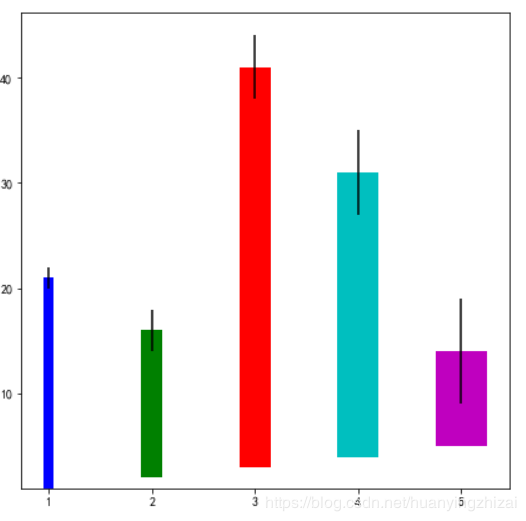
条形图是对分类变量进行描述的图形,函数为matplotlib.pyplot.bar(),主要参数如下,更多参数查阅matplotlib.pyplot.bar。或者
matplotlib.pyplot.barh()函数绘制横向的条形图,参数和bar()相同
| 参数名称 | 参数类型 | 参数说明 |
|---|---|---|
| x | sequence of scalars | 条形的坐标序列,长度为条形的个数 |
| height | scalar or sequence of scalars | 条形的高度序列,也就是每个条形对应的值序列 |
| width | scalar or array-like | 条形的宽度,默认0.8 |
| bottom | scalar or array-like | 每个条形关于纵坐标的起始点,默认为0或者None |
| align | {‘center’, ‘edge’} | 条形与x轴的对齐位置,center表示条形中心对齐x轴坐标,edge为左边缘对齐x轴坐标,若要设置右对齐,需要设置为edge并且width同时为负。默认为center |
| color | scalar or array-like | 条形颜色 |
| edgecolor | scalar or array-like | 条形边界颜色 |
| linewidth | scalar or array-like | 条形边界的宽度,若为0则不画边界 |
| tick_label | string or array-like | 条形的标签,默认为None |
| xerr, yerr | scalar or array-like of shape(N,) or shape(2,N) | 误差线,在条形顶部添加水平或垂直的某长度的误差线,水平的误差线很少使用,两者都默认为None,即不添加误差线。误差线也有一些自己的设置如颜色长度等 |
| orientation | {‘vertical’, ‘horizontal’} | 条形图垂直或者水平,默认垂直 |
import matplotlib.pyplot as plt

fig = plt.figure(figsize = (7, 7))

x = [1,2,3,4,5]
h = [20, 14, 38, 27, 9]
w = [0.1, 0.2, 0.3, 0.4, 0.5]
b = [1,2,3,4,5]
c = ['b','g','r','c','m']
ye = [1, 2, 3, 4, 5]

plt.bar(x, h, w, b, color = c, yerr = ye)
plt.show()
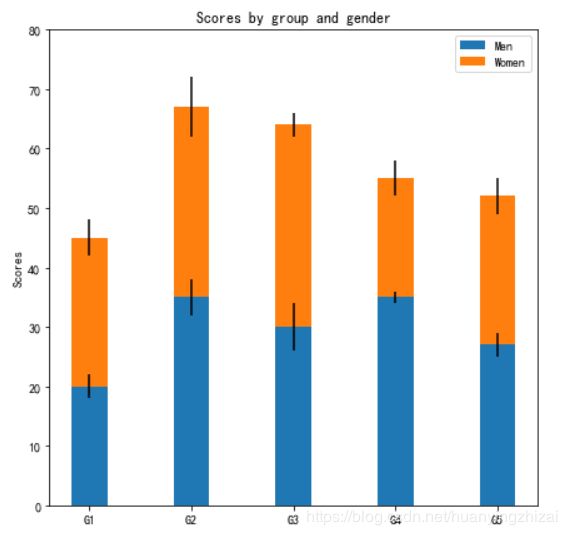
import numpy as np
import matplotlib.pyplot as plt

fig = plt.figure(figsize = (7, 7))

N = 5
menMeans = (20, 35, 30, 35, 27)
womenMeans = (25, 32, 34, 20, 25)
menStd = (2, 3, 4, 1, 2)
womenStd = (3, 5, 2, 3, 3)
ind = np.arange(N)    # the x locations for the groups
width = 0.35       # the width of the bars: can also be len(x) sequence

p1 = plt.bar(ind, menMeans, width, yerr=menStd)
p2 = plt.bar(ind, womenMeans, width,
             bottom=menMeans, yerr=womenStd)    # 设置bottom实现堆叠条形图

plt.ylabel('Scores')
plt.title('Scores by group and gender')
plt.xticks(ind, ('G1', 'G2', 'G3', 'G4', 'G5'))
plt.yticks(np.arange(0, 81, 10))
plt.legend((p1[0], p2[0]), ('Men', 'Women'))    # 这里可以直接用(p1, p2)

plt.show()
直方图
直方图是对连续变量进行统计的图表,函数为matplotlib.pyplot.hist(),主要参数如下,更多参数查阅matplotlib.pyplot.bar。或者使用hist2d
| 参数名称 | 参数类型 | 参数说明 |
|---|---|---|
| x | (n,) array or sequence of (n,) arrays | 数据,可以是一个数组或者多个不定长数组 |
| bins | int or sequence or str | 如果传入一个数字,那么表示直方的数量为bins + 1;如果传入一个列表[x1, x2, x3,…,xn],那么表示人为设置的断点,直方区间为[x1, x2), [x2, x3),…,[xn-1, xn];如果传入一些字符串如’auto’,'fd’等,更多查阅numpy.histogram_bin_edges |
| range | tuple or None | 限制展示在图表上的数据界限,若不指定默认为(x.min(), x.max()),若bins为1个序列那么range无效 |
| density | bool | 若为1调整为频率分布直方图 |
| weights | (n, ) array_like or None | 数据的权值(很少用到) |
| cumulative | bool | 直方累加,比如第二个直方显示前两个bin的总和,第三个直方显示前三个bin的总和,以此类推 |
| bottom | array_like, scalar | 规定直方关于纵轴的起始点,可以为1个数字或者与bins等长的数组 |
| histtype | {‘bar’, ‘barstacked’, ‘step’, ‘stepfilled’} | 直方图类型,默认为bar |
| align | {‘left’, ‘mid’, ‘right’} | 直方中心与每个bin对应的位置,默认mid |
| orientation | {‘horizontal’, ‘vertical’} | 直方图方向,默认垂直。或者使用barh()函数的直方图类型 |
| rwidth | scalar or None | 直方相对于bin的宽度,调整使得直方是否连续 |
| color | color or array_like of colors or None | 直方颜色,注意不是每个直方的颜色,而是每一个x对应一个颜色 |
| stacked | bool | 是否进行堆叠 |
| label | str or None | 数据标签,为了展示图里使用 |
import numpy as np
import matplotlib.pyplot as plt

# Fixing random state for reproducibility
np.random.seed(20190523)

mu, sigma = 100, 15
x = mu + sigma * np.random.randn(10000)

# the histogram of the data
plt.hist(x, 50, density=True, facecolor='g', alpha=0.75)


plt.xlabel('Smarts')
plt.ylabel('Probability')
plt.title('Histogram of IQ')
plt.text(60, .025, r'$\mu=100,\ \sigma=15$')
plt.axis([40, 160, 0, 0.03])
plt.grid(True)
plt.show()
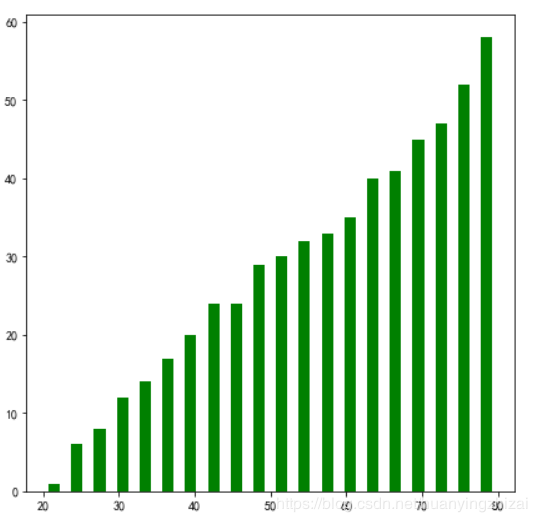
import numpy as np
import matplotlib.pyplot as plt

np.random.seed(20190523)

dt = np.random.randint(1, 101, 100)
#bins = np.arange(0, 101, 10)
bins = 20
xrange = (20, 80)

fig = plt.figure(figsize = (7, 7))
plt.hist(x = dt, bins = bins, range = xrange, cumulative = True, rwidth = 0.5, color = 'g')
plt.show()
import numpy as np
import matplotlib.pyplot as plt

np.random.seed(20190523)

dt = np.random.randint(1, 101, (100, 2))
bins = np.arange(0, 101, 10)
#bins = 20
#xrange = (20, 80)

fig = plt.figure(figsize = (7, 7))
plt.hist(x = dt, bins = bins, rwidth = 0.5, stacked = True, color = ['b', 'r'], label = ['man', 'woman'])
plt.legend()
plt.show()
散点图
前面已经用过plot()函数画散点图,现在有一个更专业的函数可以画散点图,就是matplotlib.pyplot.scatter(),主要参数如下,更多可以查阅matplotlib.pyplot.scatter
| 参数名称 | 参数类型 | 参数说明 |
|---|---|---|
| x, y | array_like, shape (n, ) | 数据 |
| s | scalar or array_like, shape (n, ) | 点的大小 |
| c | color, sequence, or sequence of color | 点的颜色,可以是一个颜色,可以是长度n的颜色序列,可以是n长的使用cmap和norm映射到颜色的数字序列,或者是用RGB或RGBA表示行的2维数组 |
| marker | MarkerStyle | 点的形状,更多参阅markers |
| cmap | Colormap | 颜色映射,仅当c为数字序列时有效 |
| norm | Normalize | 规范化,仅当c为数字序列时有效 |
| vmin, vmax | scalar | 配合norm使用 |
| alpha | scalar | 透明度,在0~1之间 |
| linewidths | scalar or array_like | 点的边界宽度 |
| edgecolors | {‘face’, ‘none’, None} or color or sequence of color | 点的边界颜色,默认为face,即背景色 |
import numpy as np
import matplotlib.pyplot as plt

# Fixing random state for reproducibility
np.random.seed(20190523)


x = np.random.rand(10)
y = np.random.rand(10)
z = np.sqrt(x**2 + y**2)

fig = plt.figure(figsize = (8, 12))
plt.subplot(321)
plt.scatter(x, y, s=80, c=z, marker=">")

plt.subplot(322)
plt.scatter(x, y, s=80, c=z, marker=(5, 0))

verts = np.array([[-1, -1], [1, -1], [1, 1], [-1, -1]])
plt.subplot(323)
plt.scatter(x, y, s=80, c=z, marker=verts)

plt.subplot(324)
plt.scatter(x, y, s=80, c=z, marker=(5, 1))

plt.subplot(325)
plt.scatter(x, y, s=80, c=z, marker='+')

plt.subplot(326)
plt.scatter(x, y, s=80, c=z, marker=(5, 2))

plt.show()
import numpy as np
import matplotlib.pyplot as plt

# Fixing random state for reproducibility
np.random.seed(20190523)


N = 50
x = np.random.rand(N)
y = np.random.rand(N)
colors = np.random.rand(N)
area = (30 * np.random.rand(N))**2  # 0 to 15 point radii

plt.figure(figsize = (7, 7))
plt.scatter(x, y, s=area, c=colors, alpha=0.5)
plt.show()
更多例子查阅scatter
堆叠图
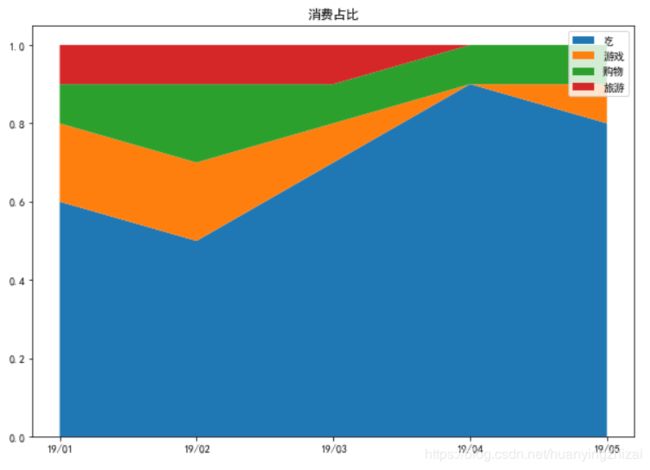
堆叠图一般用来显示各部分随时间变化的比重的变化,函数为matplotlib.pyplot.stackplot。部分参数说明如下
| 参数名称 | 参数类型 | 参数说明 |
|---|---|---|
| x | 1d array of dimension N | 时间序列 |
| y | 2d array (dimension MxN), or sequence of 1d arrays (each dimension 1xN) | 每个时间序列下的占比,如(x, y)或(x, y1, y2, y3),其中y为MxN的数组,yi为N维数组 |
| baseline | {‘zero’, ‘sym’, ‘wiggle’, ‘weighted_wiggle’} | 计算堆叠的方式,zero为基本堆叠,sym为零对称方式,更多参阅stackplot |
| labels | Length N sequence of strings | 每个部分的标签 |
| colors | Length N sequence of colors | 每个部分的颜色 |
import matplotlib.pyplot as plt

time = ['19/01', '19/02', '19/03', '19/04', '19/05']

eat = [0.6, 0.5, 0.7, 0.9, 0.8]
game = [0.2, 0.2, 0.1, 0.0, 0.1]
shopping = [0.1, 0.2, 0.1, 0.1, 0.1]
travel = [0.1, 0.1, 0.1, 0.0, 0.0]

plt.figure(figsize = (10, 7))
plt.stackplot(time, [eat, game, shopping, travel], labels = ['吃', '游戏', '购物', '旅游'])    # 这里不把yi放到[]里也是可以的
plt.legend()
plt.title('消费占比')
plt.show()
饼图
函数为matplotlib.pyplot.pie(),更多内容查阅pie。部分参数如下
| 参数名称 | 参数类型 | 参数说明 |
|---|---|---|
| x | array-like | 每部分扇形比例 |
| explode | array-like, optional, default: None | 每个扇形偏移的百分比 |
| labels | list, optional, default: None | 每个扇形的标签,显示在扇形外 |
| colors | array-like, optional, default: None | 每个扇形的颜色 |
| autopct | None (default), string, or function, optional | 若非默认会用数字来标记扇形(显示在扇形上),若为格式化字符串会显示为百分比,若为函数会被调用 |
| pctdistance | float, optional, default: 0.6 | 当auopct有效时表示数字标签与饼图中心的距离 |
| shadow | bool, optional, default: False | 显示饼图阴影 |
| labeldistance | float or None, optional, default: 1.1 | 标签的径向距离,若为None不显示标签但可以用legend()展示 |
| startangle | float, optional, default: None | 开始画扇形的角度,默认从x轴即0度开始 |
| radius | float, optional, default: None | 饼图半径,默认为1 |
| counterclock | bool, optional, default: True | 画图方向,默认逆时针 |
| wedgeprops | dict, optional, default: None | 扇形属性,如边缘颜色粗细等,如wedgeprops = {‘linewidth’: 3} |
| textprops | dict, optional, default: None | 文字属性 |
| center | list of float, optional, default: (0, 0) | 中心位置 |
| frame | bool, optional, default: False | 是否显示边框 |
| rotatelabels | bool, optional, default: False | 若为True,将标签旋转到每个切片的角度 |
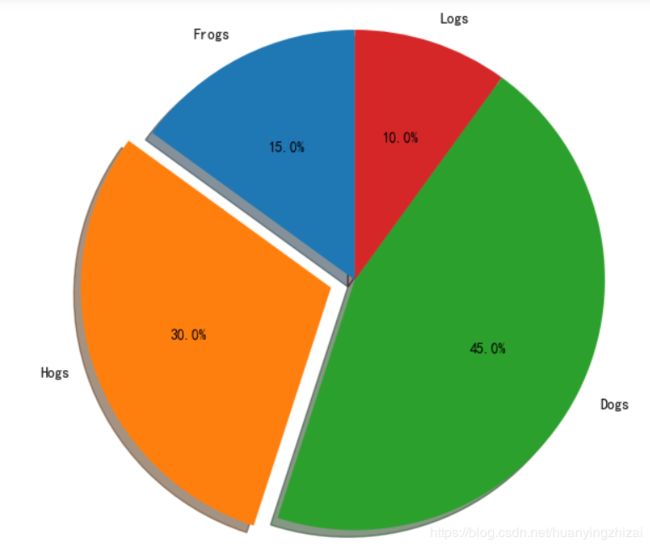
import matplotlib.pyplot as plt

# Pie chart, where the slices will be ordered and plotted counter-clockwise:
labels = 'Frogs', 'Hogs', 'Dogs', 'Logs'
sizes = [15, 30, 45, 10]    # 比例
explode = (0, 0.1, 0, 0)  # 偏移

fig1, ax1 = plt.subplots(figsize = (7, 7), dpi = 100)
ax1.pie(sizes, explode=explode, labels=labels, autopct='%1.1f%%',
        shadow=True, startangle=90)    # 从90度开始画图,标签
ax1.axis('equal')  # Equal aspect ratio ensures that pie is drawn as a circle.

plt.show()
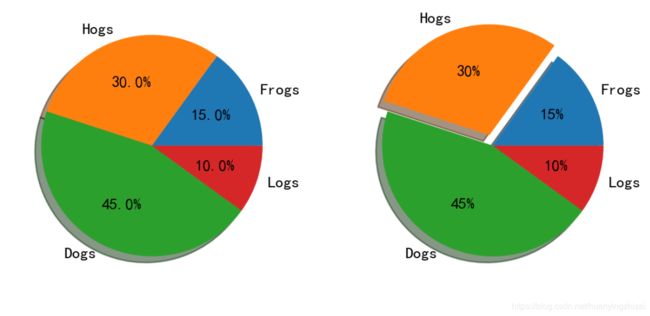
import matplotlib.pyplot as plt

labels = 'Frogs', 'Hogs', 'Dogs', 'Logs'
fracs = [15, 30, 45, 10]


fig, axs = plt.subplots(2, 2, figsize = (7, 7), dpi = 200)

# 标准饼图
axs[0, 0].pie(fracs, labels=labels, autopct='%1.1f%%', shadow=True)

# 设置偏移
axs[0, 1].pie(fracs, labels=labels, autopct='%.0f%%', shadow=True, explode=(0, 0.1, 0, 0))

# 调整文字属性和扇形半径,这里声明变量是为了对扇形进行更多的设置
patches, texts, autotexts = axs[1, 0].pie(fracs, labels=labels, autopct='%.0f%%',
                                          textprops={'size': 'smaller'}, shadow=True, radius=0.5)
# 进一步设置文字属性,注意这里是对上一个而不是下一个扇形的设置
plt.setp(autotexts, size='x-small')
autotexts[0].set_color('white')

# 去掉阴影
patches, texts, autotexts = axs[1, 1].pie(fracs, labels=labels,
                                          autopct='%.0f%%',
                                          textprops={'size': 'smaller'},
                                          shadow=False, radius=0.5,
                                          explode=(0, 0.05, 0, 0))
plt.setp(autotexts, size='x-small')
autotexts[0].set_color('white')

plt.show()
未完待续
