pyecharts快速上手(二):初始化、标题、图例、提示框配置
使用pyecharts快速上手(一):柱形图,折线图里的折线图来进行说明。
from pyecharts.charts import Bar
from pyecharts.charts import Line
from pyecharts import options as opts
from pyecharts.globals import ThemeType

x_date = [
    '2020-02-09', '2020-02-10', '2020-02-11', '2020-02-12', '2020-02-13',
    '2020-02-14', '2020-02-15', '2020-02-16', '2020-02-17', '2020-02-18'
]

y_huangshi = [760, 805, 835, 874, 911, 943, 980, 988, 988, 985]

y_ezhou = [639, 725, 790, 861, 1065, 1125, 1192, 1230, 1274, 1339]
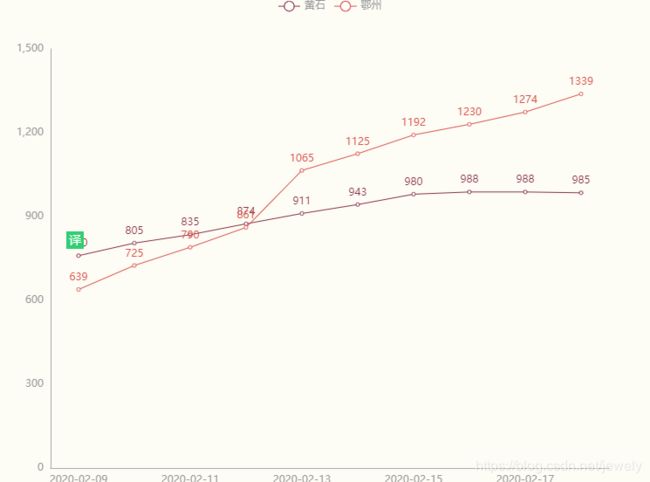
InitOpts:初始化配置项
line = Line(
    init_opts=opts.InitOpts(

        # 图表尺寸
        width='800px',
        height='600px',

        # 使用主题需导入ThemeType
        # 主题:LIGHT,DARK,CHALK,ESSOS,INFOGRAPHIC...
        theme=ThemeType.ESSOS,

        # 网页标题,图表保存为网页时起效
        page_title='Title',

        # 图表背景颜色
        # bg_color='green'
    )
)


line.add_xaxis(x_date)  # 添加x轴数据

line.add_yaxis('黄石', y_huangshi)  # 添加y轴数据

line.add_yaxis('鄂州', y_ezhou)  # 继续向y轴添加一列数据

line.render_notebook()  # 显示图表
全局配置项
使用set_global_options方法进行配置。
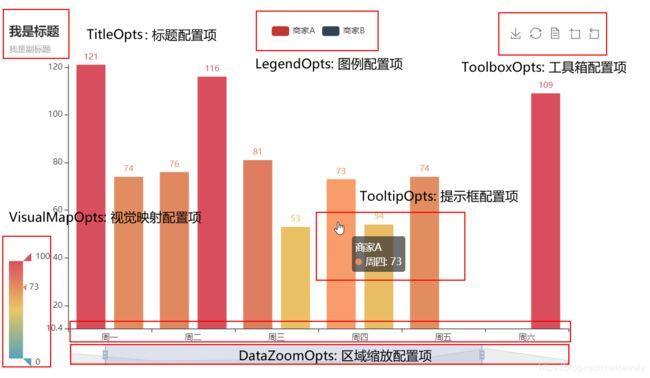
以下是几个主要的配置项示意图:

TitleOpts:标题配置项
line = Line()

line.add_xaxis(x_date)  # 添加x轴数据

line.add_yaxis('黄石', y_huangshi)  # 添加y轴数据

line.add_yaxis('鄂州', y_ezhou)  # 继续向y轴添加一列数据

line.set_global_opts(
    title_opts=opts.TitleOpts(

        # 标题文本使用 \n 换行
        title='主标题文本',
        subtitle='副标题文本',

        # 标题左右位置:pos_left,pos_right,距离图表左侧/右侧距离
        # 值可以是像素值如20,也可以是相对值'20%',或者'left'、'center'、'right'
        pos_left='20%',

        # 标题上下位置:pos_top,pos_bottom,距离图表左侧/右侧距离
        # 值可以是像素值、相对值,或者'top'、'middle'、'bottom'
        pos_top=20,

        # 主副标题间距,默认10
        item_gap=20,

        # 主副标题文字样式,调用TextStyleOpts方法设置
        # 主要配置项:
        # color,font_style,font_weight,font_family,font_size等
        title_textstyle_opts=(opts.TextStyleOpts(color='red')),
        subtitle_textstyle_opts=(opts.TextStyleOpts(font_weight='bolder')),

        # 主副标题超链接:title_link/subtitle_link
        title_link='http://www.baidu.com',

        # 跳转方式:title_target/subtitle_target,'blank'(默认)/'self'
        title_target='blank'))

line.render_notebook()
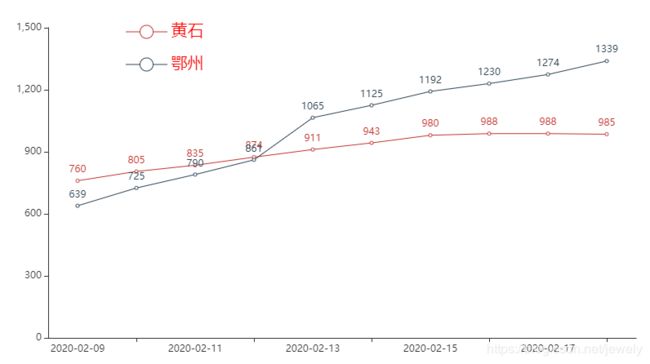
LegendOpts:图例配置项
line.set_global_opts(
    legend_opts=opts.LegendOpts(

        # 是否显示图例组件
        is_show=True,

        # 图例位置,配置方法与标题相同
        pos_left='20%',
        pos_top='50',

        # 图例布局朝向:'horizontal'(默认,横排), 'vertical'(竖排)
        orient='vertical',

        # 对齐方式:`auto`, `left`, `right`
        align='auto',

        # 图例中每项的间隔,默认10
        item_gap=20,

        # 图例宽度和高度,默认为25和14
        item_width=50,
        item_height=20,

        # 项目选择模式,'single'(只能显示一个项目),'multiple'(默认),False(关闭选择)
        selected_mode='multiple',

        # 项目处于未选中状态时的颜色,默认'#ccc'
        inactive_color='blue',

        # 字体样式,设置同标题设置
        textstyle_opts=opts.TextStyleOpts(color='red',font_size=20),

        # 项目较多时,是否允许滚动翻页
        type_='scroll'
))

line.render_notebook()
TooltipOpts:提示框配置项
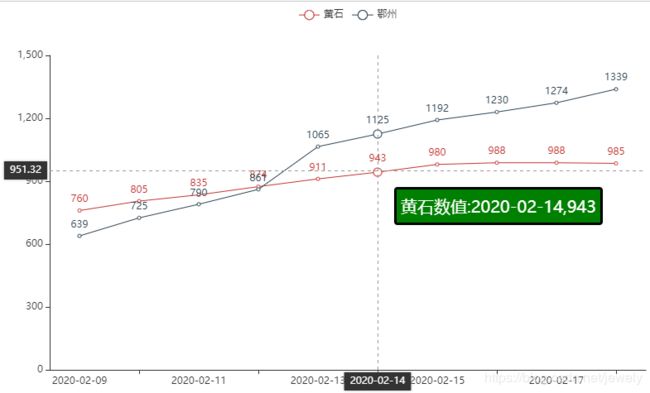
提示框是当鼠标放在图表数据项或轴上时显示的该位置的数据信息
line.set_global_opts(tooltip_opts=opts.TooltipOpts(

    # 是否显示提示框
    is_show=True,

    # 触发类型。可选:
    # 'item': 数据项图形触发,主要在散点图,饼图等无类目轴的图表中使用。
    # 'axis': 坐标轴触发,主要在柱状图,折线图等会使用类目轴的图表中使用。
    # 'none': 什么都不触发
    trigger='item',

    # 触发事件:'mousemove' 或 'click'或 'mousemove|click' 或 'none'
    trigger_on='mousemove|click',

    # 指示器类型。可选
    # 'line':直线指示器
    # 'shadow':阴影指示器
    # 'none':无指示器
    # 'cross':十字准星指示器。其实是种简写,表示启用两个正交的轴的 axisPointer。
    axis_pointer_type='cross',

    # 提示框样式配置
    background_color='green',
    border_color='black',
    border_width=3,
    textstyle_opts=opts.TextStyleOpts(font_size=20),

    # 提示框内容,还没研究透彻,仅参考
    # {a}:系列名(图例名)
    # {b}:数据名(x轴数据)
    # {c}:数据值(x,y轴数据)
    formatter='{a}数值:{c}'
))

line.render_notebook()


