D3.js-基础知识
数据可视化已变得越来越被重视,市面上也出现了越来越多的图标库,如Highcharts。图标库很容易可以上手,然而在当前注重用户交互的时代,其不易交互性突显的越来越明显。
一、数据可视化
数据可视化起源于18世纪,当时使用柱形图和折线图来表示国家进出口量。近年,随着大数据时代的到来,数据可视化作为大数据量的呈现方式,成为当前重要的课题。数据可视化的目的,是要对数据进行可视化处理,以使得能够明确地、有效地传递信息。
二、D3
D3(Data-Driven Document),是一个JavaScript的函数库,是用来做数据可视化的。Document即文档对象模型(DOM)。D3允许用户绑定任意数据到DOM,然后根据数据来操作文档,创建可交互式的图标。
D3优势:
- 数据能够与DOM绑定在一起;
- 数据转化和绘制是对立的;
- 代码简洁;
- 大量布局;
- 基于SVG(矢量图形),缩放不会损失精度。
三、SVG
SVG,指可缩放矢量图形(Scalable Vector Graphics),是用于描述二维矢量图形的一种图形格式。D3在SVG中绘制图形!!! SVG使用XML格式来定义图形,可将SVG直接嵌入HTML中显示,也可以直接将文件名改为xxx.svg来使用。
SVG中预定义了七种形状元素,分别为:矩形。
1. 矩形
| 参数 | 说明 |
|---|---|
| x | 矩形左上角的x坐标 |
| y | 矩形左上角的y坐标 |
| width | 矩形的宽度 |
| height | 矩形的高度 |
| rx | 对于圆角矩形,指定椭圆在x方向的半径 |
| ry | 对于圆角矩形,指定椭圆在y方向的半径 |
<svg width="1000" height="200" version="1.1" xmlns="http://www.w3.org/2000/svg">

    <rect x="20" y="20" width="200" height="100" style="fill: steelblue; stroke: blue; stroke-width:4; opacity: 0.5">rect>

    <rect x="250" y="20" rx="10" ry="10" width="200" height="100" style="fill: steelblue; stroke: blue; stroke-width:4; opacity: 0.5">rect>
svg>
2. 圆形和椭圆形
| 参数 | 说明 |
|---|---|
| cx | 圆心的x坐标 |
| cy | 圆形的y坐标 |
| r | (圆形)半径 |
| rx | (椭圆)水平半径 |
| ry | (椭圆)垂直半径 |
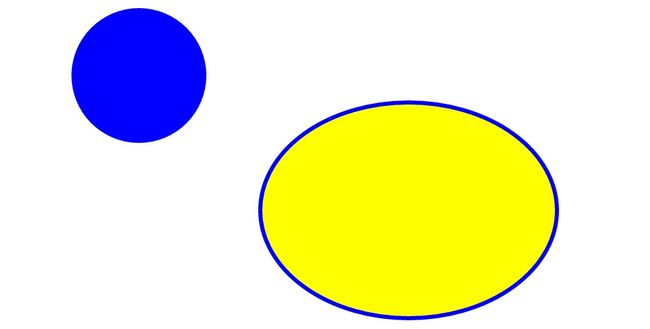
<svg width="1000" height="300" version="1.1" xmlns="http://www.w3.org/2000/svg">

    <circle cx="150" cy="50" r="50" fill="blue">circle>

    <ellipse cx="350" cy="150" rx="110" ry="80" style="fill: yellow; stroke: blue; stroke-width: 3">ellipse>
svg>
3. 线段
| 参数 | 说明 |
|---|---|
| x1 | 起点的x坐标 |
| y1 | 起点的y坐标 |
| x2 | 终点的x坐标 |
| y2 | 终点的y坐标 |
<svg width="1000" height="500" version="1.1" xmlns="http://www.w3.org/2000/svg">

    <line x1="20" y1="20" x2="50" y2="50"
        style="stroke: black; stroke-width: 3">line>
svg>
4. 多边形和折线
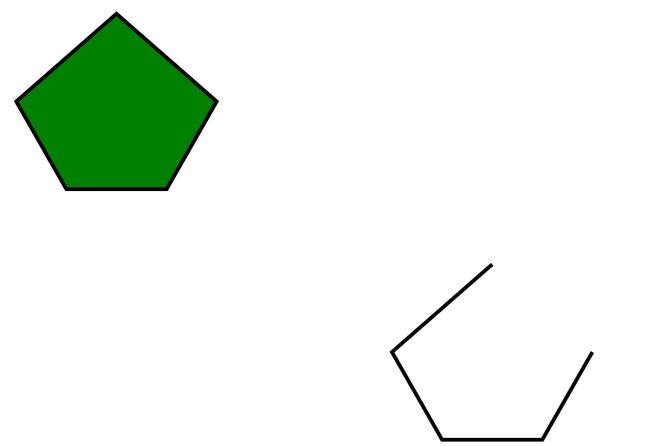
只有一个points参数,表示一系列的点坐标。
不同之处是多边形会将终点和起点连接起来。
<svg width="1000" height="500" version="1.1" xmlns="http://www.w3.org/2000/svg">

    <polygon points="100,20 20,90 60,160 140,160 180,90"
        style="fill: green; stroke: black; stroke-width: 3">polygon>

    <polyline points="400,220 320,290 360,360 440,360 480,290"
        style="fill:white; stroke: black; stroke-width: 3">polyline>
svg>
5. 路径
| 类型 | 参数 | 说明 |
|---|---|---|
| 移动类 | M = moveto | 将画笔移动到指定坐标 |
| 直线类 | L = lineto | 画直线到指定坐标 |
| 直线类 | H = horizontal lineto | 画水平直线到指定坐标 |
| 直线类 | V = vertical lineto | 画垂直直线到指定坐标 |
| 曲线类 | C = curveto | 画三次贝塞尔曲线经两个指定控制点到达终点坐标 |
| 曲线类 | S = shorthand/smooth curveto | 与第一条三次贝塞尔曲线相连,第一个控制点为前一条曲线第二个控制点的对称点,只需输入第二个控制点和终点 |
| 曲线类 | Q = quadratic Bezier curveto | 画二次贝塞尔曲线经一个指定控制点到达终点坐标 |
| 曲线类 | T = shorthand/smooth quadratic Bezier curveto | 与前一条二次贝塞尔曲线相连,控制点为前一条二次贝塞尔曲线控制点的对称点,只需输入终点 |
| 弧线类 | A = elliptical arc | 画椭圆曲线到指定坐标 |
| 闭合类 | Z = closepath | 绘制一条直线连接终点和起点,用来封闭图形 |
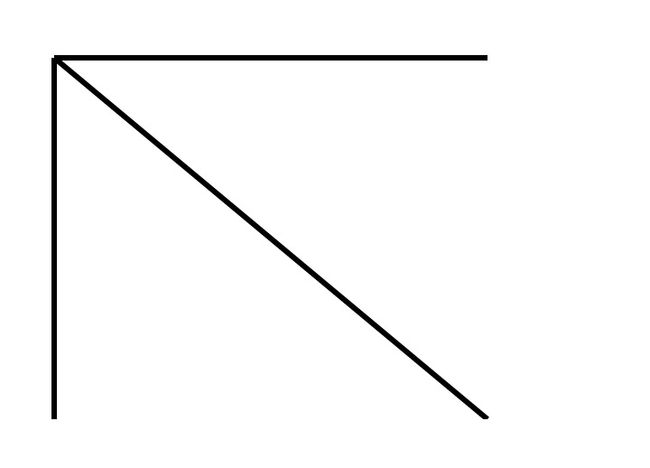
<svg width="1000" height="300" version="1.1" xmlns="http://www.w3.org/2000/svg">

    <path d="M30,100 L270,300
                 M30,100 H270
                 M30,100 V300"
          style="stroke: black; stroke-width: 3px;">
    path>
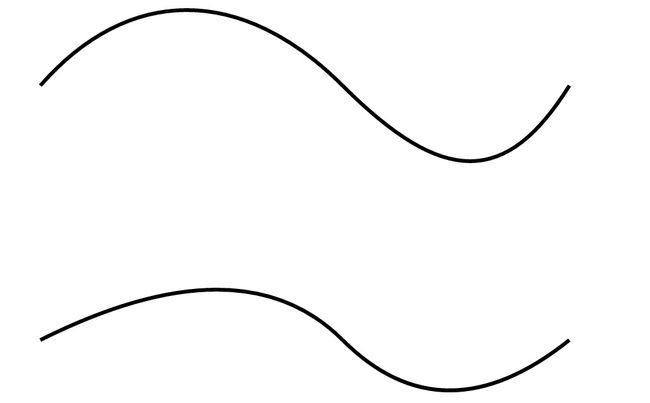
svg><svg width="1000" height="200" version="1.1" xmlns="http://www.w3.org/2000/svg">
<path d="M30,100 C100,20 190,20 270,100
S400,180 450,100"
style="fill:white; stroke: black; stroke-width: 3px;">
path>
svg>
<svg width="1000" height="200" version="1.1" xmlns="http://www.w3.org/2000/svg">
<path d="M30,100 Q190,20 270,100
T450 100"
style="fill:white; stroke: black; stroke-width: 3px;">
path>
svg><svg width="1000" height="500" version="1.1" xmlns="http://www.w3.org/2000/svg">
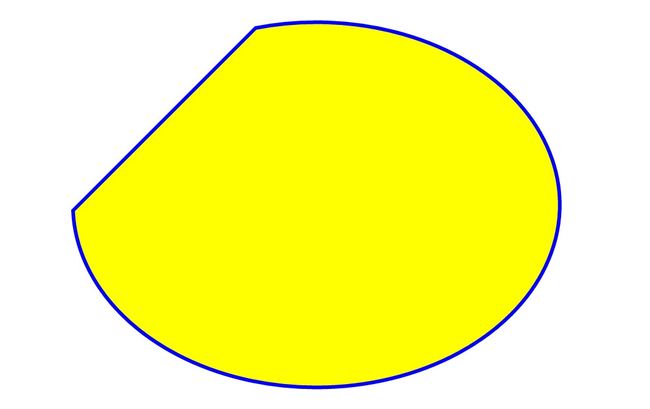
<path d="M100,200 a200,150 0 1, 0 150,-150 Z"
style="fill:yellow; stroke: blue; stroke-width: 3px;">
path>
svg>
<svg width="1000" height="500" version="1.1" xmlns="http://www.w3.org/2000/svg">
<path d="M100,200 A200,150 0 1, 0 250,50 Z"
style="fill:yellow; stroke: blue; stroke-width: 3px;">
path>
svg>6、 文字
在SVG中可以使用标签绘制文字。
| 参数 | 说明 |
|---|---|
| x | 文字位置的x坐标 |
| y | 文字位置的y坐标 |
| dx | 相对于当前位置在x方向上平移的距离(正则往右,负则往左) |
| dy | 相对于当前位置在y方向上平移的距离(正则往下,负则往上) |
| textLength | 文字的显示长度(不足则拉长,足则压缩) |
| rotate | 旋转角度(顺时针正,逆时针负) |
<svg width="500" height="300" xmlns="http://www.w3.org/2000/svg">
    <text x="100" y="150" dx="-50" dy="-50" rotate="0" textLength="90">
        I love <tspan fill="blue">D3tspan>
    text>
svg>
