MATLAB学习笔记 学习总结归纳(第三周)
MATLAB学习笔记 彩色变换
interp1q(x, y, xi) 线性内插,获得xi点的yi值(直线)
x 为列向量 设置x轴各个点
y 为列向量 设置y轴的各个点
xi 为列向量,代表取xi的位置的值
z = interp1q([0 10]', [0 5]', [0 1 2]') % 返回[0; 0.5; 1.0]spline(x, y, xi) 三次样条内插, 获得xi的yi值(曲线)
z = spline([0:2]', [0:4]', [0:3]') % 返回[1; 2; 3; 15]ice(‘p’, ‘v’, …) 交互颜色编辑
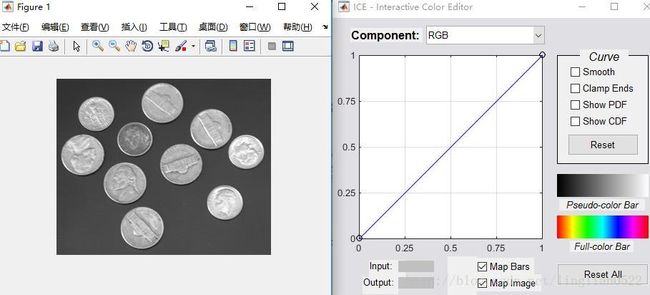
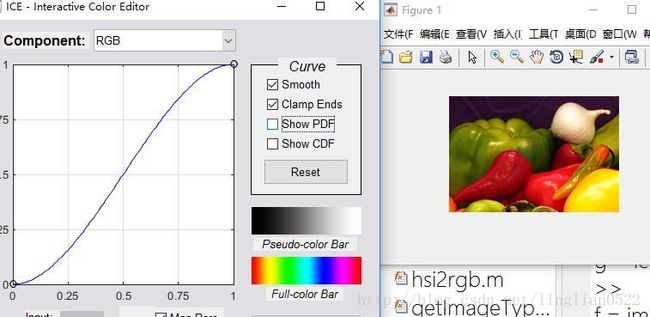
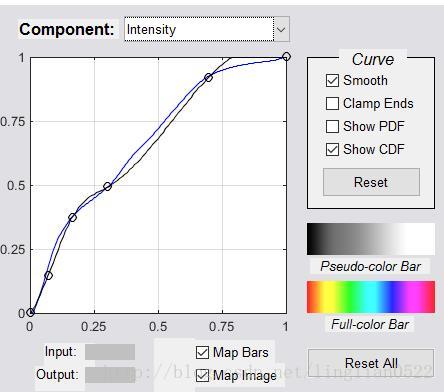
ice(‘image’, f) 显示图像编辑
f = imread('coins.png');
g = ice('image', f);ice(‘image’, f, ‘wait’, ‘off’) 如果wait为off 会立即释放控制,为on则锁定控制
g = ice('image', f, 'wait', 'off');
h = get(g);
h.Nameice 窗口操作
| 鼠标操作 | 结果 |
|---|---|
| 左键 | 按住并拖动来移动控制点 |
| 左键+Shift键 | 添加控制点。拖动(同时按住Shift键)可改变控制点的位置 |
| 左键+Control键 | 删除控制点 |
鼠标左键代表移动, 鼠标中键代表添加, 右键代表删除
| GUI元素 | 描述 |
|---|---|
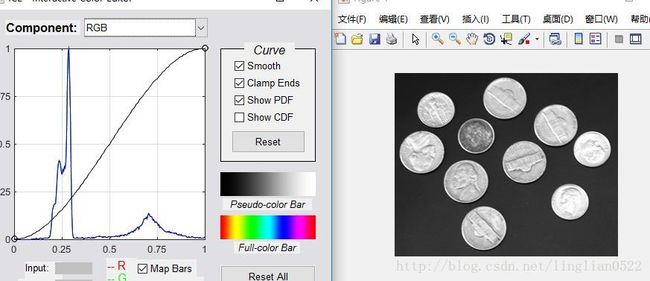
| Smooth | 选择则使用三次样条内插 |
| Clamp Ends | 选择则强制将三次样条的起始和结束曲线斜度设置为0 |
| Show PDF | 显示被映射函数影响的图像分量的概率密度函数(即直方图) |
| Show CDF | 显示累计分布函数并非PDF(注意,PDF和CDF不能同时显示 |
| Map Image | 选中则启动图像映射,默认选中 |
| Map Bars | 选择则启动伪彩色和全彩色条带映射 |
| Reset | 重置 |
| Reset All | 重置所有 |
| Input/Output | 显示坐标,Input为x轴,Output为y轴 |
| Component | 为交互操作选择一个映射函数,就是选择图片的哪个分量进行操作 |
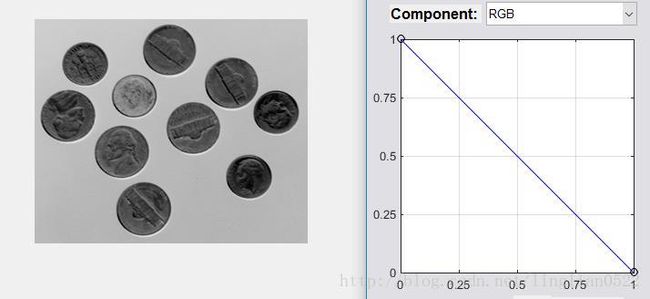
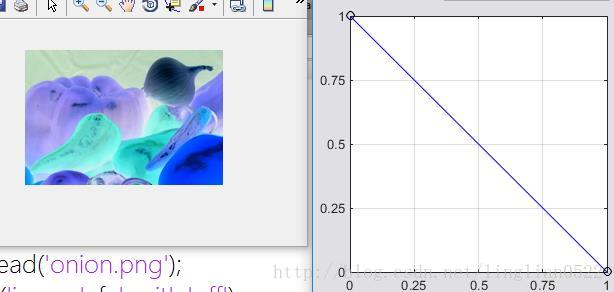
单色负片和彩色分量的反映射
% 单色
f = imread('coins.png');
g = ice('image', f, 'wait', 'off');% 彩色
f = imread('onion.png');
g = ice('image', f, 'wait', 'off');单色和彩色对比度增强
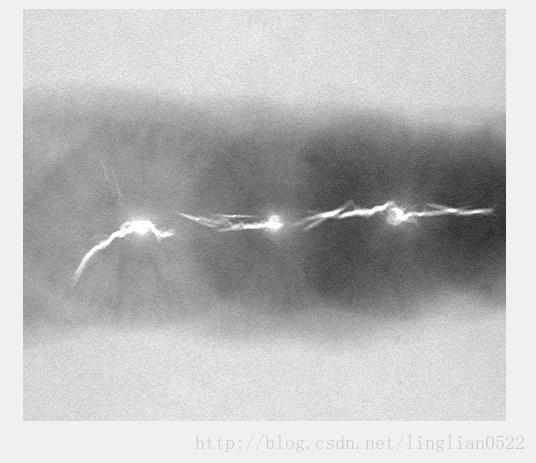
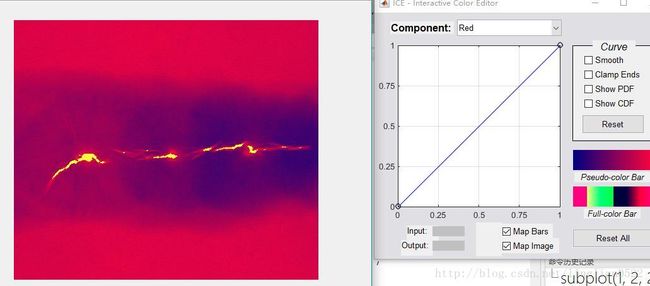
伪彩色映射
f = imread('img2.tif');
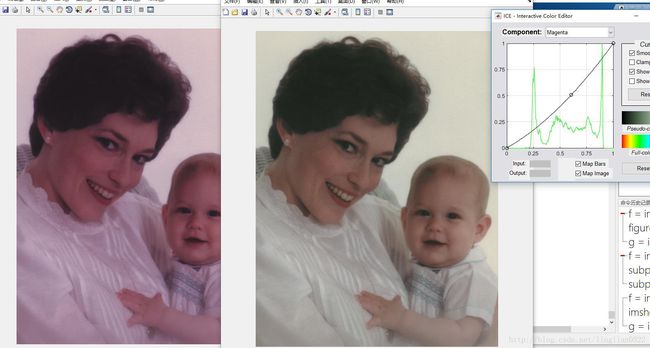
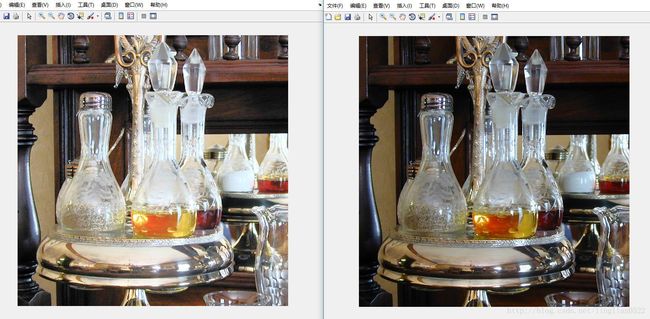
g = ice('image', f);彩色平衡
f = imread('mb.tif');
imshow(f);
g = ice('image', f, 'space', 'CMY');基于直方图的映射
f = imread('img3.tif');
imshow(f);
g = ice('image', f, 'space', 'hsi');彩色图像的空间滤波
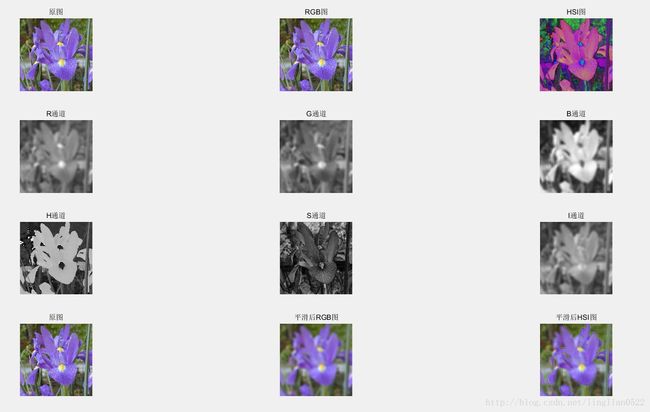
彩色图像平滑
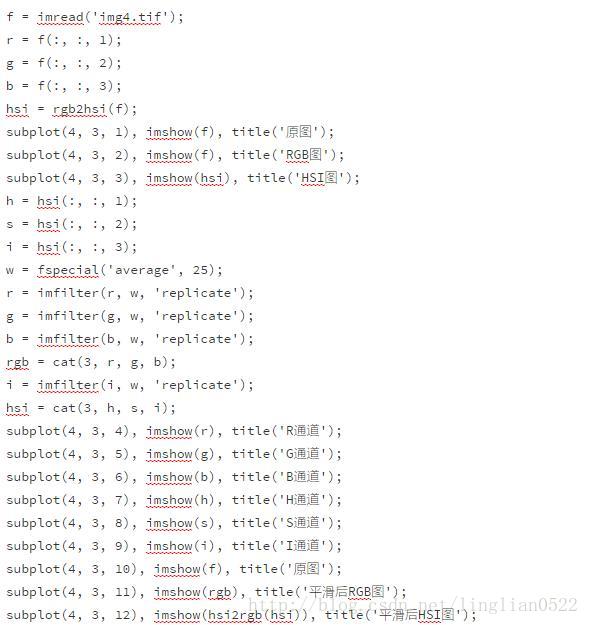
分别对RGB通道三分量进行平滑,对HSI的I通道进行平滑
 f = imread('img4.tif');
 r = f(:, :, 1);
 g = f(:, :, 2);
 b = f(:, :, 3);
 hsi = rgb2hsi(f);
 subplot(4, 3, 1), imshow(f), title('原图');
 subplot(4, 3, 2), imshow(f), title('RGB图');
 subplot(4, 3, 3), imshow(hsi), title('HSI图');
 h = hsi(:, :, 1);
 s = hsi(:, :, 2);
 i = hsi(:, :, 3);
 w = fspecial('average', 25);
 r = imfilter(r, w, 'replicate');
 g = imfilter(g, w, 'replicate');
 b = imfilter(b, w, 'replicate');
 rgb = cat(3, r, g, b);
 i = imfilter(i, w, 'replicate');
 hsi = cat(3, h, s, i);
 subplot(4, 3, 4), imshow(r), title('R通道');
 subplot(4, 3, 5), imshow(g), title('G通道');
 subplot(4, 3, 6), imshow(b), title('B通道');
 subplot(4, 3, 7), imshow(h), title('H通道');
 subplot(4, 3, 8), imshow(s), title('S通道');
 subplot(4, 3, 9), imshow(i), title('I通道');
 subplot(4, 3, 10), imshow(f), title('原图');
 subplot(4, 3, 11), imshow(rgb), title('平滑后RGB图');
subplot(4, 3, 12), imshow(hsi2rgb(hsi)), title('平滑后HSI图');彩色图像锐化
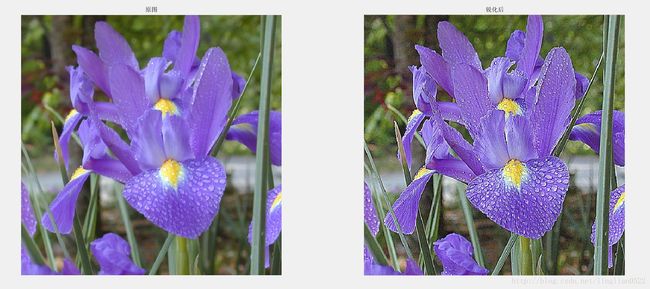
f = imread('img4.tif');
g = tofloat(f);
la = [1 1 1; 1 -8 1; 1 1 1];
subplot(1, 2, 1), imshow(f), title('原图');
subplot(1, 2, 2), imshow(g - imfilter(g, la, 'replicate')), title('锐化后');直接在RGB向量空间的处理
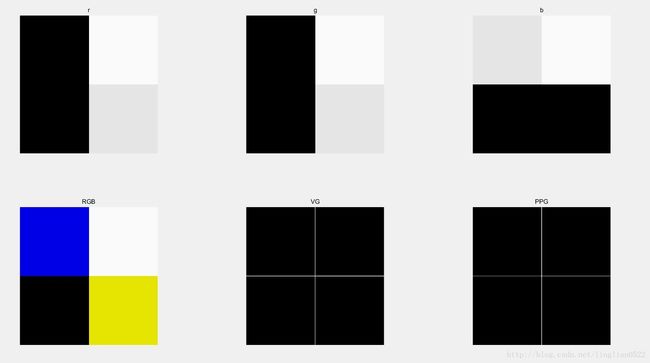
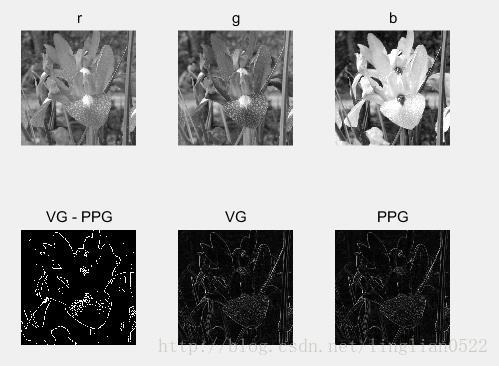
利用梯度进行彩色边缘检测
colorgrad(image, T) 可以用来检测RGB图像的边缘
还可以设置T用来将一些边缘消除
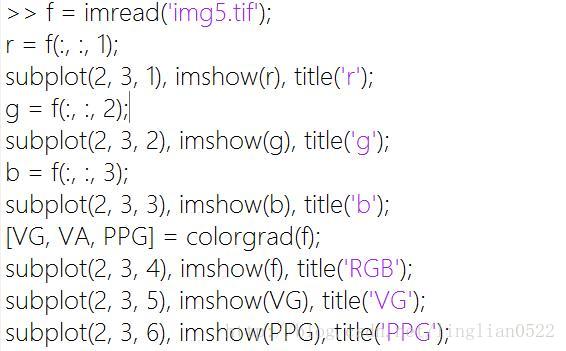
f = imread('img5.tif');
r = f(:, :, 1);
subplot(2, 3, 1), imshow(r), title('r');
g = f(:, :, 2);
subplot(2, 3, 2), imshow(g), title('g');
b = f(:, :, 3);
subplot(2, 3, 3), imshow(b), title('b');
[VG, VA, PPG] = colorgrad(f);
subplot(2, 3, 4), imshow(f), title('RGB');
subplot(2, 3, 5), imshow(VG), title('VG');
subplot(2, 3, 6), imshow(PPG), title('PPG');获得彩图的边缘
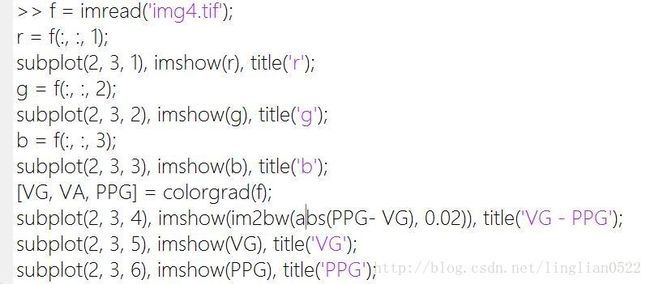
f = imread('img4.tif');
r = f(:, :, 1);
subplot(2, 3, 1), imshow(r), title('r');
g = f(:, :, 2);
subplot(2, 3, 2), imshow(g), title('g');
b = f(:, :, 3);
subplot(2, 3, 3), imshow(b), title('b');
[VG, VA, PPG] = colorgrad(f);
subplot(2, 3, 4), imshow(im2bw(abs(PPG- VG), 0.02)), title('VG - PPG');
subplot(2, 3, 5), imshow(VG), title('VG');
subplot(2, 3, 6), imshow(PPG), title('PPG');在RGB向量空间中进行图像分割
colorseg(method, f, T, parameters)图像分割
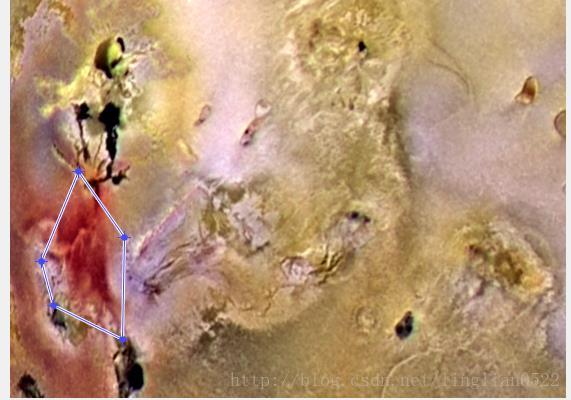
先获取一块区域
f = imread('img6.tif');
mask = roipoly(f);
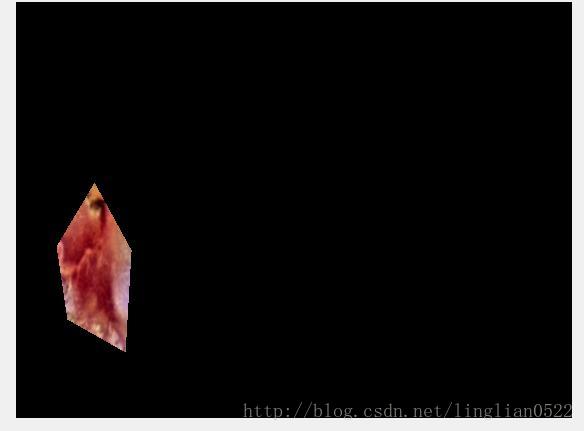
red = immultiply(mask, f(:, :, 1));
green= immultiply(mask, f(:, :, 2));
blue= immultiply(mask, f(:, :, 3));
g = cat(3, red, green, blue);
imshow(g);接下来计算三个分量的标准差
[M, N, K] = size(g);
I = reshape(g, M * N, 3);
idx = find(mask);
I = double(I(idx, 1:3));
[C, m] = covmatrix(I);
d = diag(C);
sd = sqrt(d)
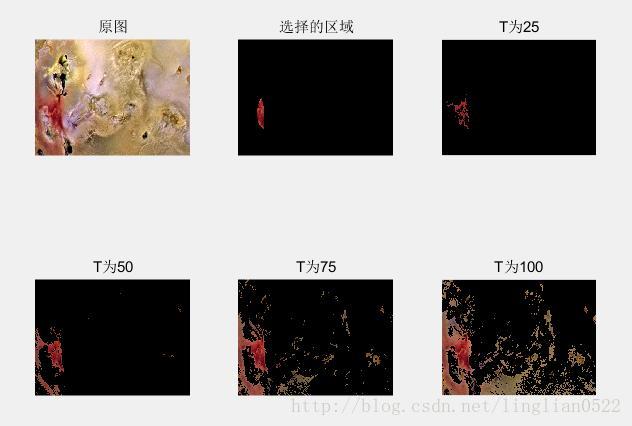
接着使用colorseg进行图像精准分割
欧式距离(euclidean)
马氏距离()
f = imread('img6.tif');
mask = roipoly(f);
red = immultiply(mask, f(:, :, 1));
green= immultiply(mask, f(:, :, 2));
blue= immultiply(mask, f(:, :, 3));
g = cat(3, red, green, blue);
imshow(g);
[M, N, K] = size(g);
I = reshape(g, M * N, 3);
idx = find(mask);
I = double(I(idx, 1:3));
[C, m] = covmatrix(I);
d = diag(C);
sd = sqrt(d)
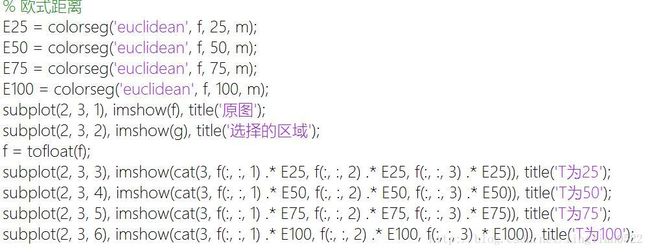
% 欧式距离
E25 = colorseg('euclidean', f, 25, m);
E50 = colorseg('euclidean', f, 50, m);
E75 = colorseg('euclidean', f, 75, m);
E100 = colorseg('euclidean', f, 100, m);
subplot(2, 3, 1), imshow(f), title('原图');
subplot(2, 3, 2), imshow(g), title('选择的区域');
f = tofloat(f);
subplot(2, 3, 3), imshow(cat(3, f(:, :, 1) .* E25, f(:, :, 2) .* E25, f(:, :, 3) .* E25)), title('T为25');
subplot(2, 3, 4), imshow(cat(3, f(:, :, 1) .* E50, f(:, :, 2) .* E50, f(:, :, 3) .* E50)), title('T为50');
subplot(2, 3, 5), imshow(cat(3, f(:, :, 1) .* E75, f(:, :, 2) .* E75, f(:, :, 3) .* E75)), title('T为75');
subplot(2, 3, 6), imshow(cat(3, f(:, :, 1) .* E100, f(:, :, 2) .* E100, f(:, :, 3) .* E100)), title('T为100');集合论的基本概念
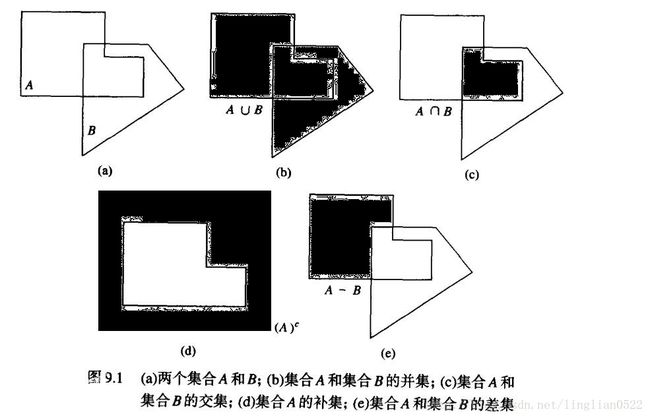
并 交 补 差
| 集合运算 | MATLAB中的语句 | 名称 |
|---|---|---|
| A ⋂ B | A & B | 与 |
| A ⋃ B | A | B | 或 |
| Ac | ~A | 非 |
| A - B | A & ~ B | 差 |
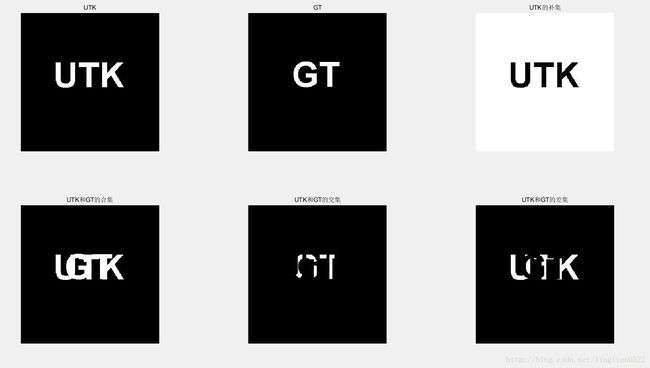
下面用代码来看看效果
 f = imread('utk.tif');
 g = imread('gt.tif');
 subplot(2, 3, 1), imshow(f), title('UTK');
 subplot(2, 3, 2), imshow(g), title('GT');
 subplot(2, 3, 3), imshow(~f), title('UTK的补集');
 subplot(2, 3, 4), imshow(f | g), title('UTK和GT的合集');
 subplot(2, 3, 5), imshow(f & g), title('UTK和GT的交集');
subplot(2, 3, 6), imshow(f & ~g), title('UTK和GT的差集');膨胀
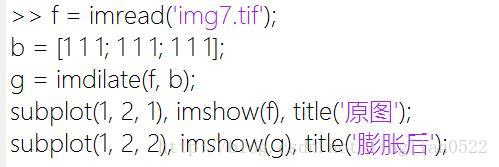
imdilate(A, B) 膨胀运算
f = imread('img7.tif');
b = [1 1 1; 1 1 1; 1 1 1];
g = imdilate(f, b);
subplot(1, 2, 1), imshow(f), title('原图');
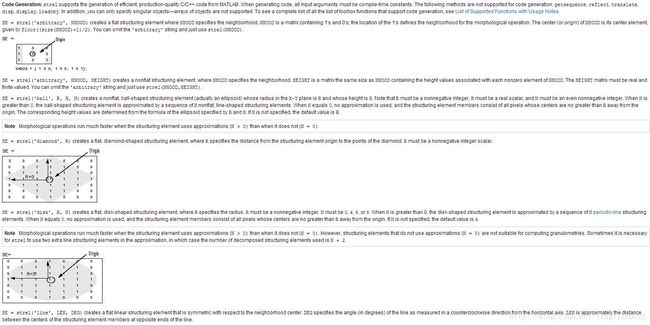
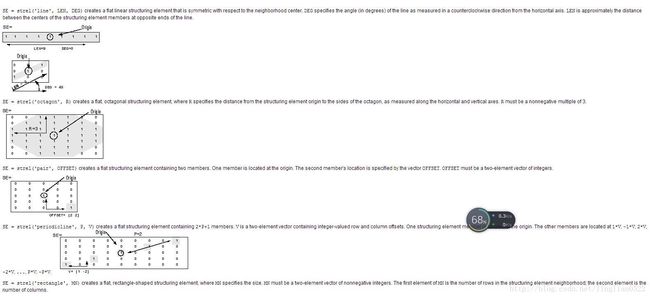
subplot(1, 2, 2), imshow(g), title('膨胀后');strel(‘mode’, R) 获得指定形状大小的结构
doc strel腐蚀
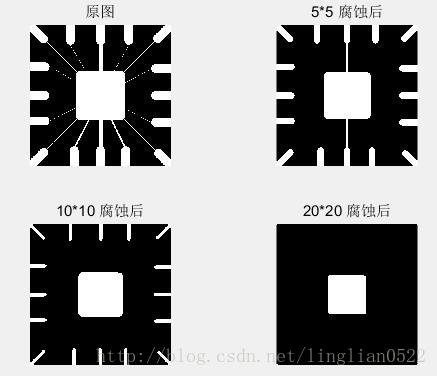
imerode(image, s) 对图像进行腐蚀操作
f = imread('img8.tif');
se = strel('disk', 10);
g = imerode(f, se);
subplot(1, 2, 1), imshow(f), title('原图');
subplot(1, 2, 2), imshow(g), title('腐蚀后');
利用一个10*10的菱形进行腐蚀
* 输入:

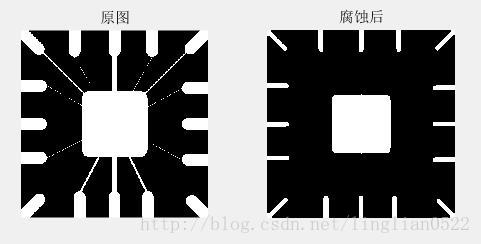
利用其它大小的菱形进行腐蚀后的结果
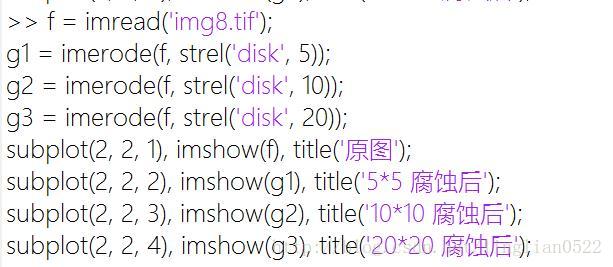
f = imread('img8.tif');
g1 = imerode(f, strel('disk', 5));
g2 = imerode(f, strel('disk', 10));
g3 = imerode(f, strel('disk', 20));
subplot(2, 2, 1), imshow(f), title('原图');
subplot(2, 2, 2), imshow(g1), title('5*5 腐蚀后');
subplot(2, 2, 3), imshow(g2), title('10*10 腐蚀后');
subplot(2, 2, 4), imshow(g3), title('20*20 腐蚀后');腐蚀和膨胀的组合
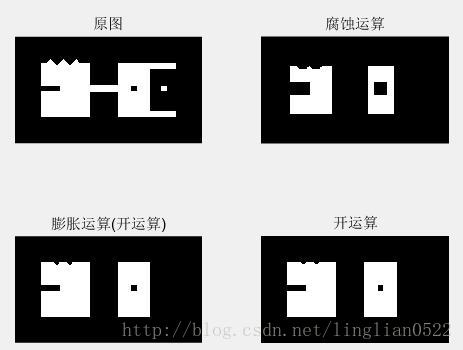
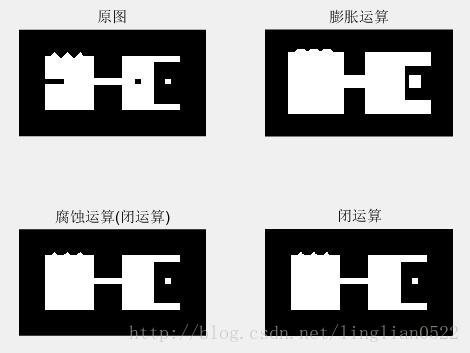
imopen(A, B) 将A,B进行开运算
A被B腐蚀后再用B来膨胀
f = imread('img9.tif');
se = strel('square', 20);
g = imopen(f, se);
g1 = imerode(f, se);
g2 = imdilate(g1, se);
subplot(2, 2, 1), imshow(f), title('原图');
subplot(2, 2, 2), imshow(g1), title('腐蚀运算');
subplot(2, 2, 3), imshow(g2), title('膨胀运算(开运算)');
subplot(2, 2, 4), imshow(g), title('开运算');imclose(A, B) 将A,B进行闭运算
A被B膨胀在用B腐蚀,跟开运算相反
f = imread('img9.tif');
se = strel('square', 20);
g = imclose(f, se);
g1 = imdilate(f, se);
g2 = imerode(g1, se);
subplot(2, 2, 1), imshow(f), title('原图');
subplot(2, 2, 2), imshow(g1), title('膨胀运算');
subplot(2, 2, 3), imshow(g2), title('腐蚀运算(闭运算)');
subplot(2, 2, 4), imshow(g), title('闭运算');一般来说都是将开闭操作配合使用,可以达到去除噪声的效果。
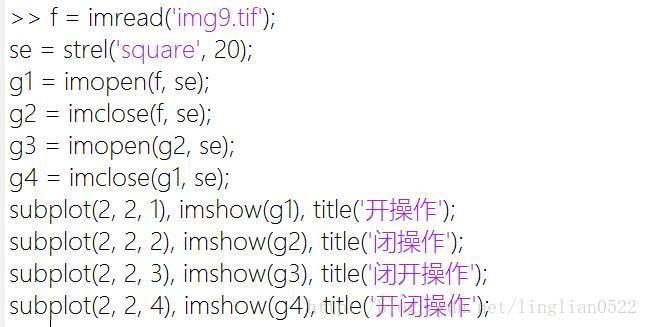
在这之前,我们先研究一下开闭操作和闭开操作
f = imread('img9.tif');
se = strel('square', 20);
g1 = imopen(f, se);
g2 = imclose(f, se);
g3 = imopen(g2, se);
g4 = imclose(g1, se);
subplot(2, 2, 1), imshow(g1), title('开操作');
subplot(2, 2, 2), imshow(g2), title('闭操作');
subplot(2, 2, 3), imshow(g3), title('闭开操作');
subplot(2, 2, 4), imshow(g4), title('开闭操作');可以看出,闭开 和 开闭是没有区别的!所以先开或者先闭得到的结果也就一样啦。
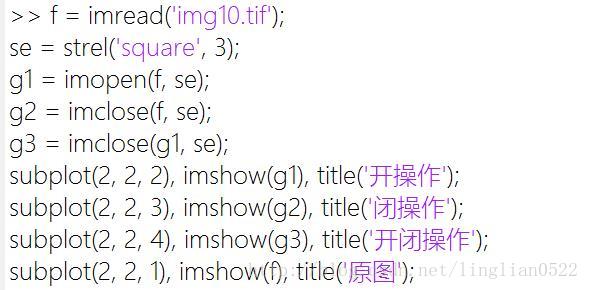
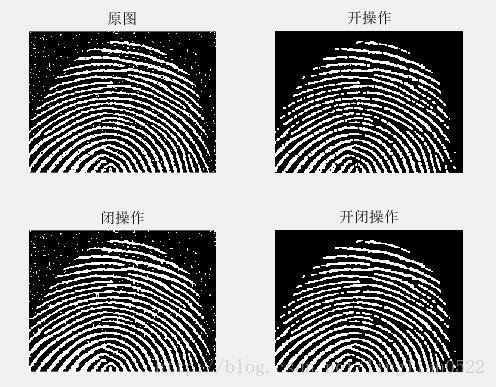
接着看看他去除噪音的效果
f = imread('img10.tif');
se = strel('square', 3);
g1 = imopen(f, se);
g2 = imclose(f, se);
g3 = imclose(g1, se);
subplot(2, 2, 2), imshow(g1), title('开操作');
subplot(2, 2, 3), imshow(g2), title('闭操作');
subplot(2, 2, 4), imshow(g3), title('开闭操作');
subplot(2, 2, 1), imshow(f), title('原图');bwhitmiss(A, B1, B2) 击中或未击中, B1为击中的结构,B2为未击中的结构
取B1击中的地方和B2未击中的地方
f = imread('img11.tif');
B1 = [0 0 0; 0 1 1; 0 1 0];
B2 = [1 1 1; 1 0 0; 1 0 0];
g = bwhitmiss(f, B1, B2);
subplot(1, 2, 1), imshow(f), title('原图');
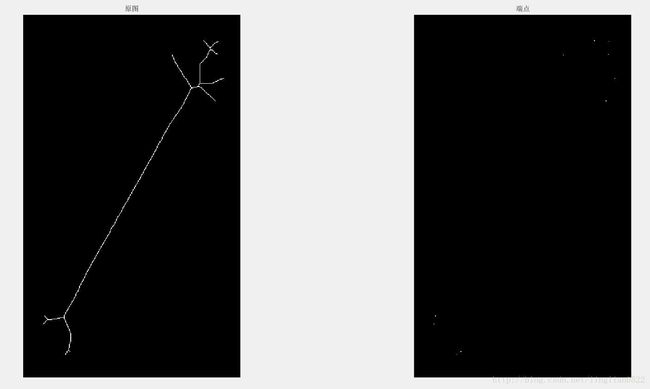
subplot(1, 2, 2), imshow(g), title('处理后');**endpoints(f) 使用makelut 和 applylut 在二值图中检测端点
f = imread('img12.tif');
g = endpoints(f);
subplot(1, 2, 1), imshow(f), title('原图');
subplot(1, 2, 2), imshow(g), title('端点');- 输入:

- 输出:
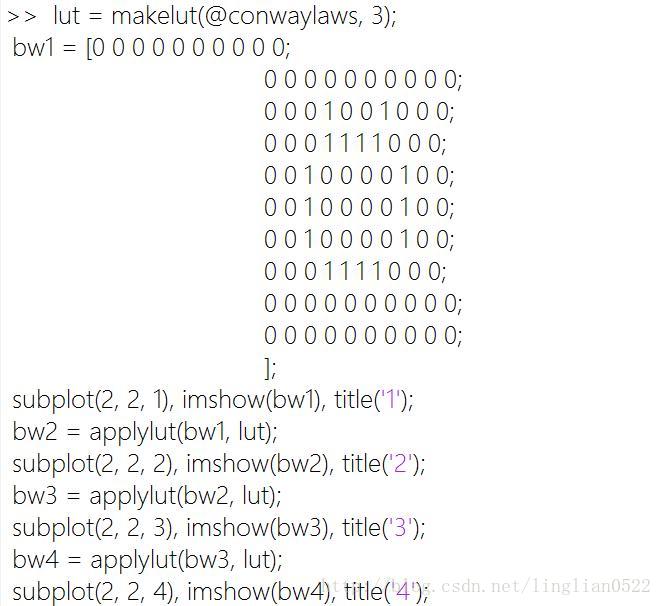
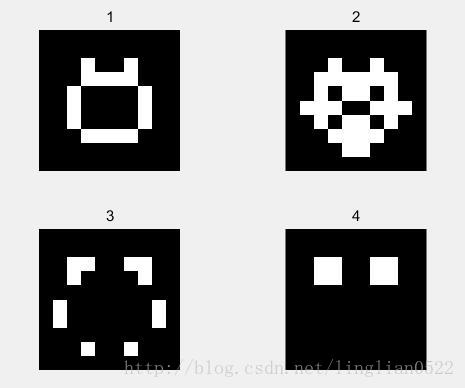
书中大脸猫实验
 lut = makelut(@conwaylaws, 3);
 bw1 = [0 0 0 0 0 0 0 0 0 0;
 0 0 0 0 0 0 0 0 0 0;
 0 0 0 1 0 0 1 0 0 0;
 0 0 0 1 1 1 1 0 0 0;
 0 0 1 0 0 0 0 1 0 0;
 0 0 1 0 0 0 0 1 0 0;
 0 0 1 0 0 0 0 1 0 0;
 0 0 0 1 1 1 1 0 0 0;
 0 0 0 0 0 0 0 0 0 0;
 0 0 0 0 0 0 0 0 0 0;
 ];
 subplot(2, 2, 1), imshow(bw1), title('1');
 bw2 = applylut(bw1, lut);
 subplot(2, 2, 2), imshow(bw2), title('2');
 bw3 = applylut(bw2, lut);
 subplot(2, 2, 3), imshow(bw3), title('3');
 bw4 = applylut(bw3, lut);
 subplot(2, 2, 4), imshow(bw4), title('4');
- 输出:
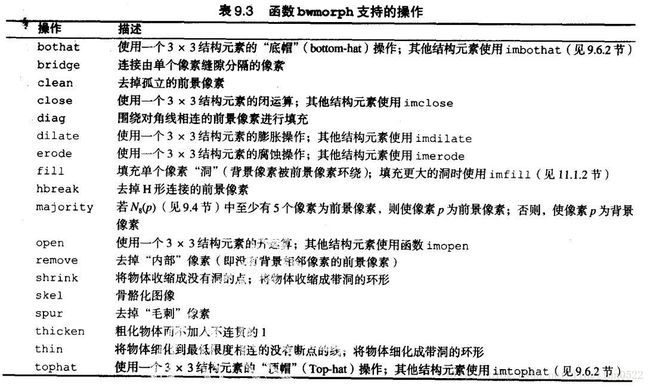
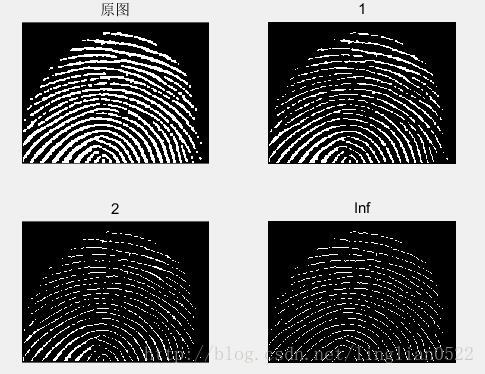
bwmorph(f, opeartion, n) 将操作(膨胀,腐蚀,查找)进行组合操作
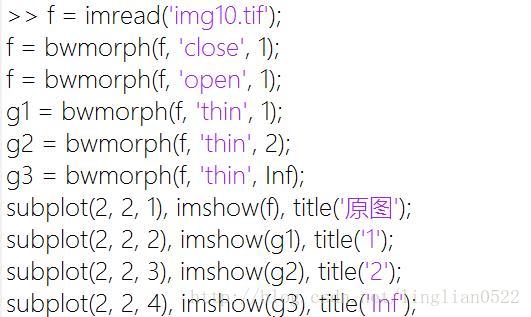
细化操作 thin
f = imread('img10.tif');
f = bwmorph(f, 'close', 1);
f = bwmorph(f, 'open', 1);
g1 = bwmorph(f, 'thin', 1);
g2 = bwmorph(f, 'thin', 2);
g3 = bwmorph(f, 'thin', Inf);
subplot(2, 2, 1), imshow(f), title('原图');
subplot(2, 2, 2), imshow(g1), title('1');
subplot(2, 2, 3), imshow(g2), title('2');
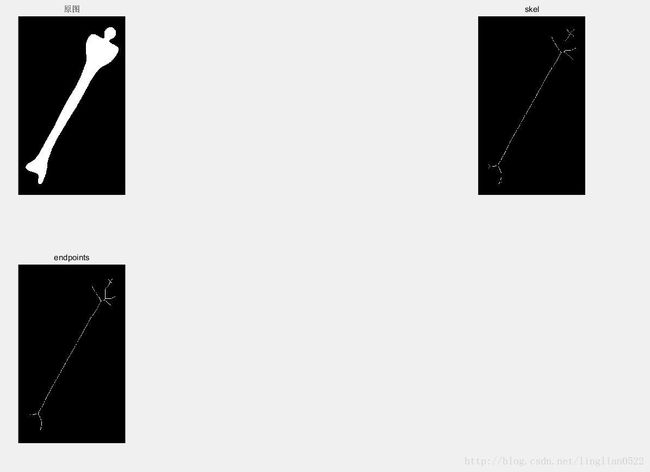
subplot(2, 2, 4), imshow(g3), title('Inf');骨骼操作 skel
f = imread('img13.tif');
g1 = bwmorph(f, 'skel', Inf);
g2 = g1;
for k = 1 : 5
    g2 = g2 & ~endpoints(g2);
end
subplot(2, 2, 1), imshow(f), title('原图');
subplot(2, 2, 2), imshow(g1), title('skel');
subplot(2, 2, 3), imshow(g2), title('endpoints');图像分割
点检测
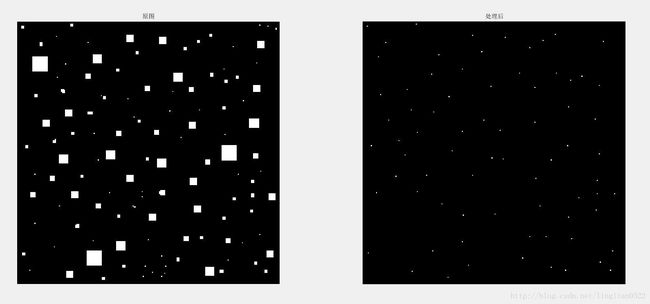
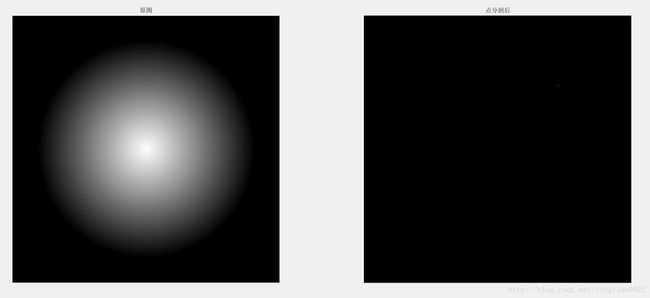
先用线性滤波将图像进行处理,接着找出g的最大值,再将小于T的点去除(找出值为T的点)。
f = imread('img14.tif');
w = [-1 -1 -1; -1 8 -1; -1 -1 -1];
g = abs(imfilter(double(f), w));
T = max(g(:));
g = g >= T;
subplot(1, 2, 1), imshow(f), title('原图');
subplot(1, 2, 2), imshow(g), title('点分割后');线检测
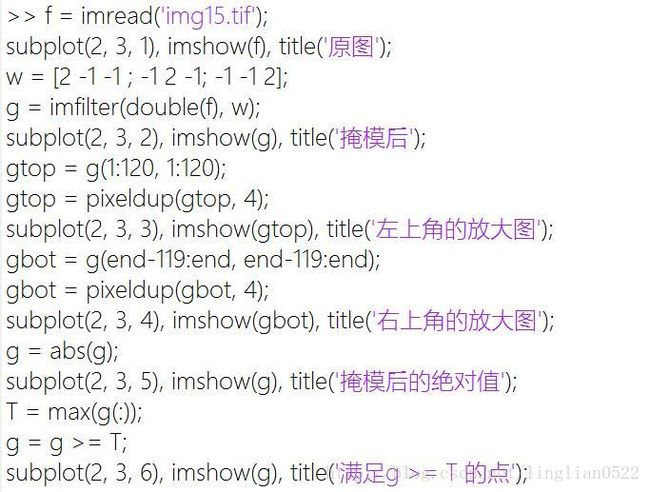
其中pixedup(f, n) 将图片放大n倍
f = imread('img15.tif');
subplot(2, 3, 1), imshow(f), title('原图');
w = [2 -1 -1 ; -1 2 -1; -1 -1 2];
g = imfilter(double(f), w);
subplot(2, 3, 2), imshow(g), title('掩模后');
gtop = g(1:120, 1:120);
gtop = pixeldup(gtop, 4);
subplot(2, 3, 3), imshow(gtop), title('左上角的放大图');
gbot = g(end-119:end, end-119:end);
gbot = pixeldup(gbot, 4);
subplot(2, 3, 4), imshow(gbot), title('右上角的放大图');
g = abs(g);
subplot(2, 3, 5), imshow(g), title('掩模后的绝对值');
T = max(g(:));
g = g >= T;
subplot(2, 3, 6), imshow(g), title('满足g >= T 的点');edge(f, ‘method’, par) 边缘检测函数
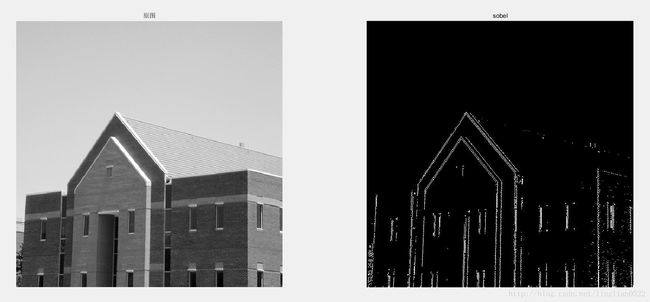
sobel边缘检测器(默认为sobel)
edge(f, ‘sobel’, T, dir);
dir 分为 vertical horizontal both(默认) 三种
f = imread('img16.tif');
g = edge(f, 'sobel', 'vertical');
subplot(1, 2, 1), imshow(f), title('原图');
subplot(1, 2, 2), imshow(g), title('sobel');Prewitt边缘检测器
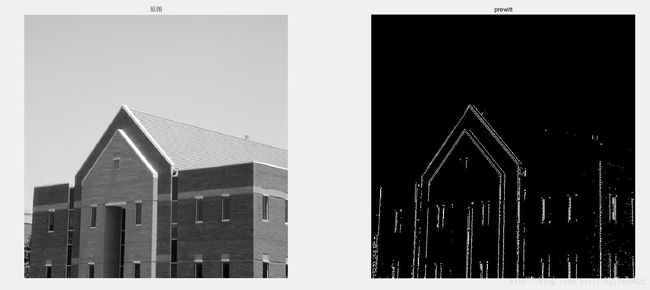
edge(f, ‘prewitt’, T, dir);
f = imread('img16.tif');
g = edge(f, 'prewitt', 'vertical');
subplot(1, 2, 1), imshow(f), title('原图');
subplot(1, 2, 2), imshow(g), title('prewitt');Roberts边缘检测器
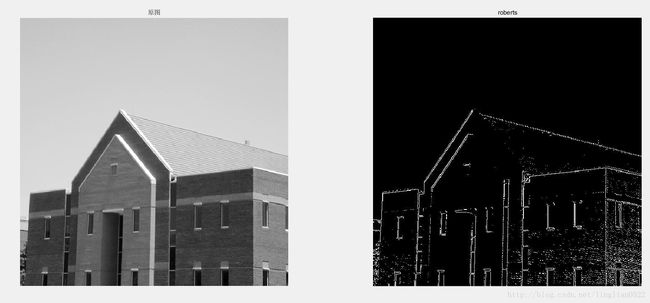
edge(f, ‘roberts’, T, dir);
f = imread('img16.tif');
g = edge(f, 'roberts', 'vertical');
subplot(1, 2, 1), imshow(f), title('原图');
subplot(1, 2, 2), imshow(g), title('roberts');LoG边缘检测器
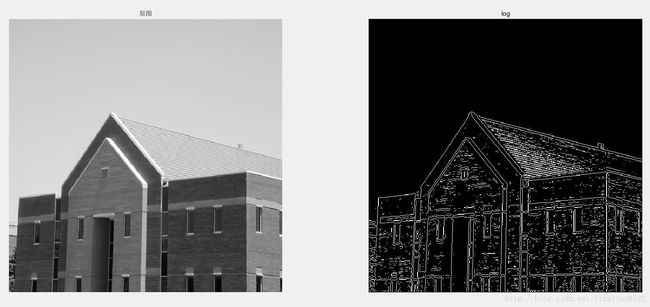
edge(f, ‘log’, T, sigma);
f = imread('img16.tif');
g = edge(f, 'log', 'vertical');
subplot(1, 2, 1), imshow(f), title('原图');
subplot(1, 2, 2), imshow(g), title('log');零交叉检测器
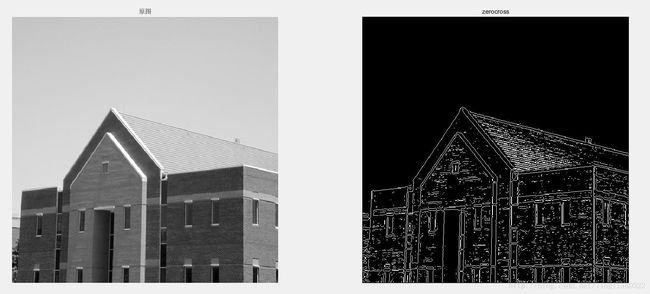
edge(f, ‘zerocross’, T, H);
f = imread('img16.tif');
g = edge(f, 'zerocross', 'vertical');
subplot(1, 2, 1), imshow(f), title('原图');
subplot(1, 2, 2), imshow(g), title('zerocross');Canny边缘检测器
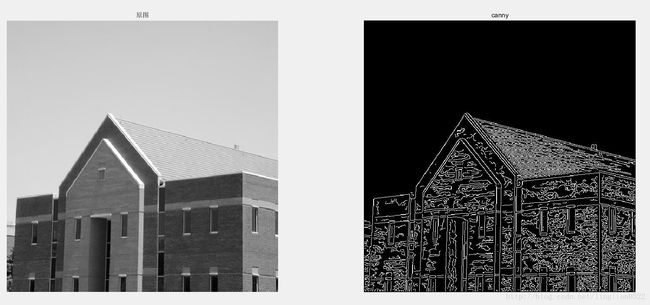
edge(f, ‘canny’, T, sigma);
f = imread('img16.tif');
g = edge(f, 'canny', 'vertical');
subplot(1, 2, 1), imshow(f), title('原图');
subplot(1, 2, 2), imshow(g), title('canny');使用Sobel
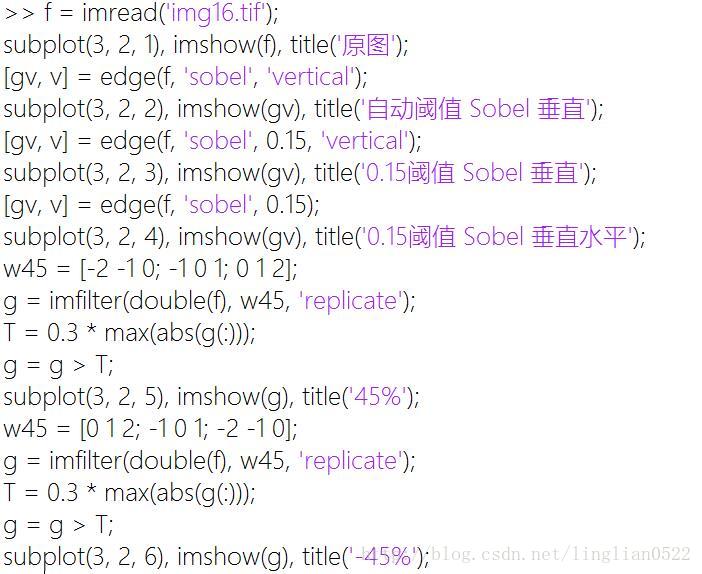
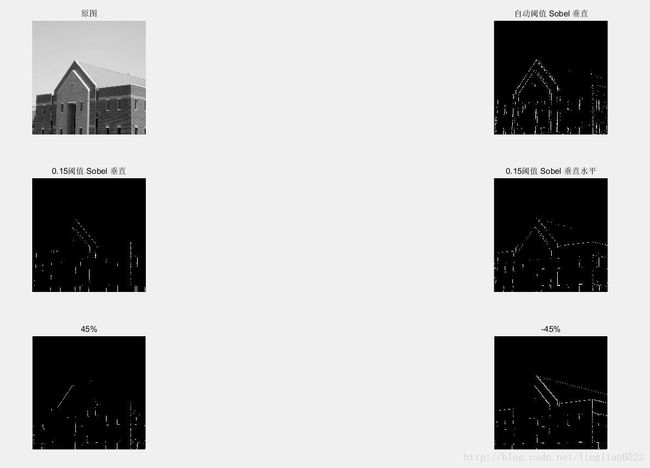
f = imread('img16.tif');
subplot(3, 2, 1), imshow(f), title('原图');
[gv, v] = edge(f, 'sobel', 'vertical');
subplot(3, 2, 2), imshow(gv), title('自动阈值 Sobel 垂直');
[gv, v] = edge(f, 'sobel', 0.15, 'vertical');
subplot(3, 2, 3), imshow(gv), title('0.15阈值 Sobel 垂直');
[gv, v] = edge(f, 'sobel', 0.15);
subplot(3, 2, 4), imshow(gv), title('0.15阈值 Sobel 垂直水平');
w45 = [-2 -1 0; -1 0 1; 0 1 2];
g = imfilter(double(f), w45, 'replicate');
T = 0.3 * max(abs(g(:)));
g = g > T;
subplot(3, 2, 5), imshow(g), title('45%');
w45 = [0 1 2; -1 0 1; -2 -1 0];
g = imfilter(double(f), w45, 'replicate');
T = 0.3 * max(abs(g(:)));
g = g > T;
subplot(3, 2, 6), imshow(g), title('-45%');所有检测器比较
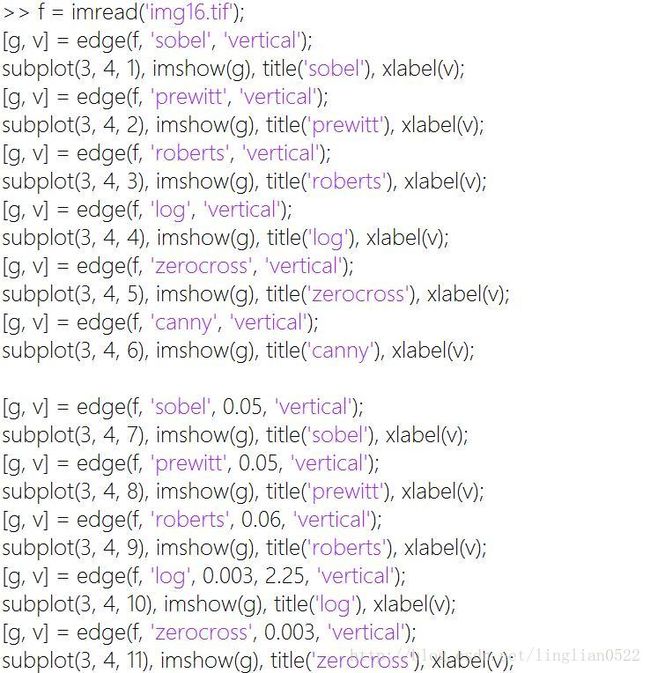
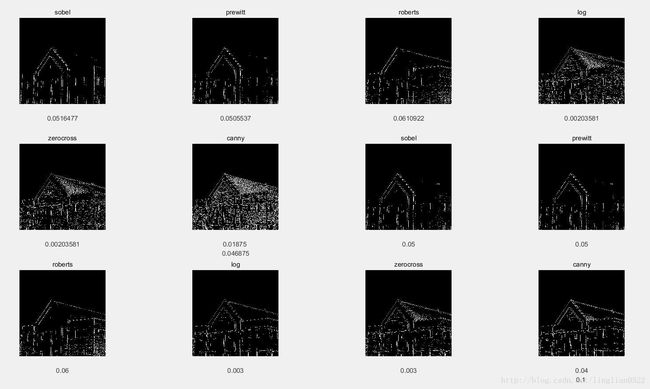
sobel prewitt roberts log zerocross canny
f = imread('img16.tif');
[g, v] = edge(f, 'sobel', 'vertical');
subplot(3, 4, 1), imshow(g), title('sobel'), xlabel(v);
[g, v] = edge(f, 'prewitt', 'vertical');
subplot(3, 4, 2), imshow(g), title('prewitt'), xlabel(v);
[g, v] = edge(f, 'roberts', 'vertical');
subplot(3, 4, 3), imshow(g), title('roberts'), xlabel(v);
[g, v] = edge(f, 'log', 'vertical');
subplot(3, 4, 4), imshow(g), title('log'), xlabel(v);
[g, v] = edge(f, 'zerocross', 'vertical');
subplot(3, 4, 5), imshow(g), title('zerocross'), xlabel(v);
[g, v] = edge(f, 'canny', 'vertical');
subplot(3, 4, 6), imshow(g), title('canny'), xlabel(v);

[g, v] = edge(f, 'sobel', 0.05, 'vertical');
subplot(3, 4, 7), imshow(g), title('sobel'), xlabel(v);
[g, v] = edge(f, 'prewitt', 0.05, 'vertical');
subplot(3, 4, 8), imshow(g), title('prewitt'), xlabel(v);
[g, v] = edge(f, 'roberts', 0.06, 'vertical');
subplot(3, 4, 9), imshow(g), title('roberts'), xlabel(v);
[g, v] = edge(f, 'log', 0.003, 2.25, 'vertical');
subplot(3, 4, 10), imshow(g), title('log'), xlabel(v);
[g, v] = edge(f, 'zerocross', 0.003, 'vertical');
subplot(3, 4, 11), imshow(g), title('zerocross'), xlabel(v);
[g, v] = edge(f, 'canny', [0.04, 0.10], 1.5 , 'vertical');
subplot(3, 4, 12), imshow(g), title('canny'), xlabel(v);Hough变换的线检测
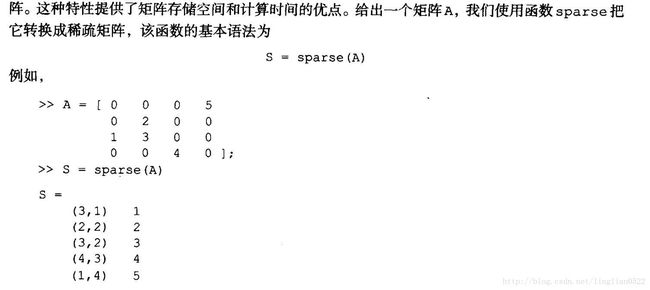
sparse(r, c, s, m, n)将矩阵变为稀疏矩阵
full(S) 可以将稀疏矩阵还原
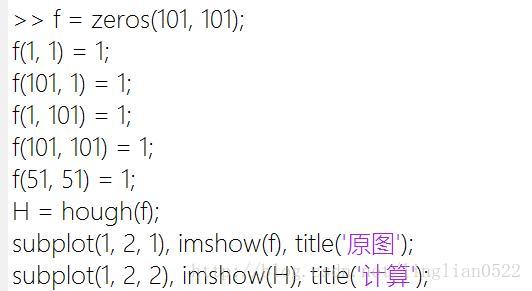
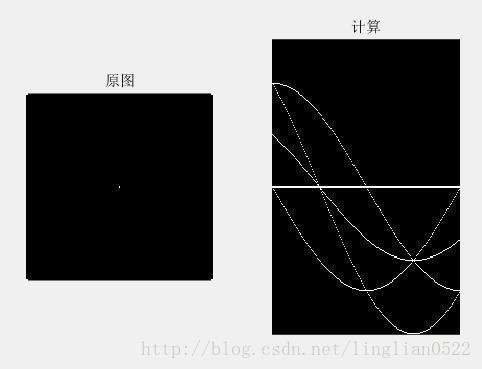
hough(f, dtheta, drho) 计算Hough变换
f = zeros(101, 101);
f(1, 1) = 1;
f(101, 1) = 1;
f(1, 101) = 1;
f(101, 101) = 1;
f(51, 51) = 1;
H = hough(f);
subplot(1, 2, 1), imshow(f), title('原图');
subplot(1, 2, 2), imshow(H), title('计算');利用Hough变换做峰值处理 houghpeaks
- 找到包含有最大值的hough变换单元并记下它的位置
- 把第一步中找到的最大值点的邻域中的hough变换单元设为零
- 重复该步骤,直到找到需要的峰值数时为止,或者达到一个指定的阈值时为止
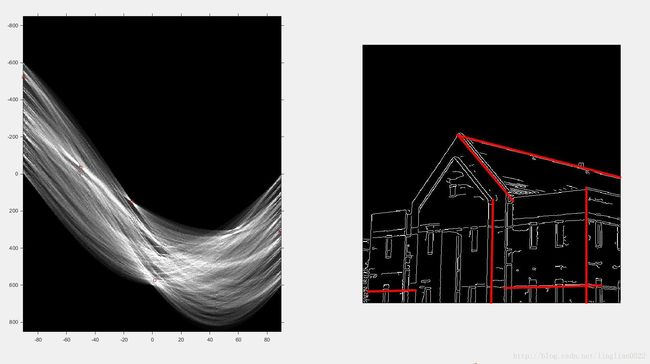
利用Hough变换做线检测和链接
houghpixels(f, theta, rho, rbin, cbin)
找到图像中影响到峰值的每一个非零值点的位置。
houghlines(f, theta, rho, rr, cc, fillgap, minlength)
f = imread('img16.tif');
f = edge(f, 'canny', [0.04, 0.10], 1.5 , 'vertical');
[H, theta, rho] = hough(f, 0.5);
subplot(1, 2, 1), imshow(imadjust(mat2gray(H)), 'XData', theta, 'YData', rho, 'InitialMagnification', 'fit'), axis on, axis normal;
[r, c] = houghpeaks(H, 5);
hold on;
plot(theta(c), rho(r), 'LineStyle', 'none', 'marker', 's', 'color', 'r');
lines = houghlines(f, theta, rho, r, c);
subplot(1, 2, 2), imshow(f), hold on;
for k = 1:length(lines)
xy = [lines(k).point1 ; lines(k).point2];
plot(xy(:, 2),xy(:,1),'LineWidth', 4, 'Color', 'r');
end阈值处理
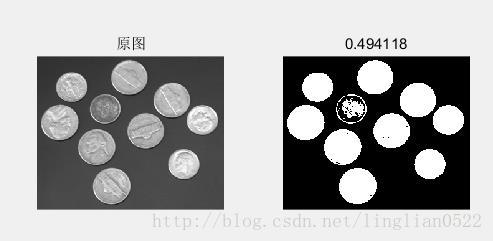
* graythresh(f) 获得图像的阈值[0, 1]*
f = imread('coins.png');
T = graythresh(f);
g = im2bw(f, T);
subplot(1, 2, 1), imshow(f), title('原图');
subplot(1, 2, 2), imshow(g), title(T);计算全局阈值
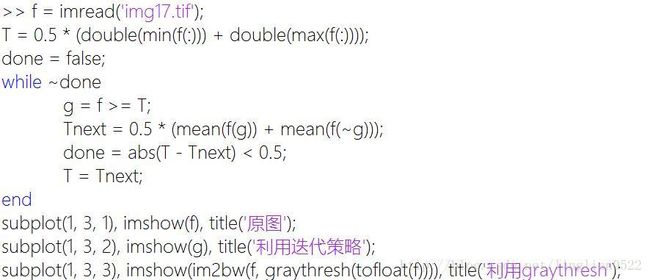
f = imread('img17.tif');
T = 0.5 * (double(min(f(:))) + double(max(f(:))));
done = false;
while ~done
    g = f >= T;
    Tnext = 0.5 * (mean(f(g)) + mean(f(~g)));
    done = abs(T - Tnext) < 0.5;
    T = Tnext;
end
subplot(1, 3, 1), imshow(f), title('原图');
subplot(1, 3, 2), imshow(g), title('利用迭代策略');
subplot(1, 3, 3), imshow(im2bw(f, graythresh(tofloat(f)))), title('利用graythresh');局部阈值处理
f = imread('img17.tif');
g = imsubtract(imadd(f, imtophat(f, strel('disk', 3))), imtophat(f, strel('disk', 3)));
subplot(1, 3, 1), imshow(f), title('原图');
subplot(1, 3, 2), imshow(g), title('顶帽后');
subplot(1, 3, 3), imshow(im2bw(g, graythresh(tofloat(g)))), title('顶帽后进行阈值处理');表示与描述
表示区域涉及到二个基本选择:
* 用外部特征(区域的边境)表示区域
* 用内部特征(组成区域的像素)表示区域
描述就是你在表示区域的基础上进行的,例如区域可以用边界表示,而边界可以用诸如边界长度和其包含的凹面形状的数目等特征来描述。
单元数组与结构
单元数组
就是cell
a = [1 2 3];
c = {'asd', a, 12};
disp(c); % 输出'asd'    [1x3 double]    [12]
使用的话就用{}来表示下标
a = [1 2 3];
c = {'asd', a, 12};
disp(c{2}); % 输出 1 2 3
disp(c{2}(2)); % 输出 2
用()可以获得单元数组元素的信息(基本元素则直接输出)
a = [1 2 3];
c = {'asd', a, 12};
c(1) % 输出 'asd'
c(2) % 输出 [1x3 double]
同样适用于size函数!
celldisp 递归输出单元数组的信息(就是会输出单元数组里的元素数据而不是元素信息)
a = [1 2 3];
c = {'asd', a, 12};
celldisp(c); % 输出 c{1} = asd c{2} = 1 2 3 c{3} = 12
disp(c); % 输出'asd' [1x3 double] [12]
cellfun(@fun, C) 可以将C 的元素依次调用fun(C), gen celldisp差不多
a = [1 2 3];
c = {'asd', a, 12};
[r c] = cellfun(@size, c);
r, c % 输出 r = 1 1 1 c = 3 3 1
结构
类似于高级语言的结构体(类)
调用方法也也差不多。
s.a = 1;
s.b = 2;
s % 输出s = a: 1 b: 2
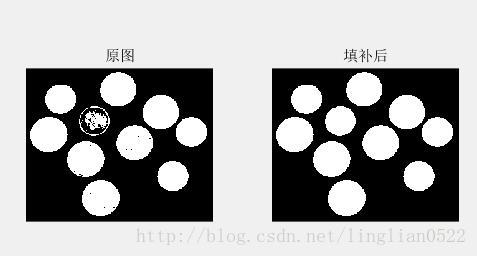
imfill(f, locations, conn) 将二值图洞填补
主要用于将洞填补,例如下面这个(其中,洞只亮的部分被暗的部分所包围的地方[不算背景边界])。
f = imread('coins.png');
f = im2bw(f);
g = imfill(f, 4, 'holes');
subplot(1, 2, 1), imshow(f), title('原图');
subplot(1, 2, 2), imshow(g), title('填补后');bwlabel(f) 将二值图分区(可以用来计数)
比如下面这个,可以数清楚硬币有10个!
f = imread('coins.png');
f = im2bw(f);
f = imfill(f, 4, 'holes');
[g, n] = bwlabel(f);
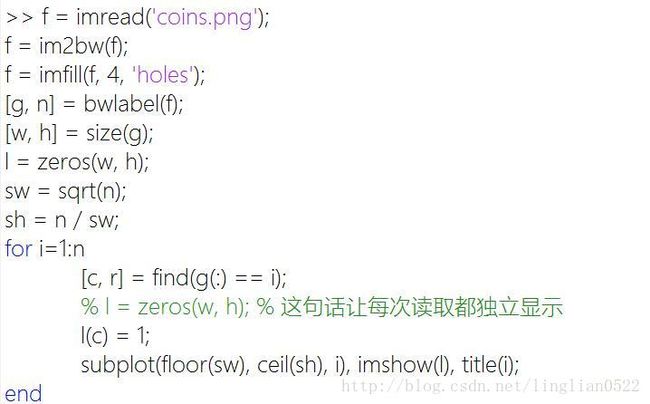
如果这个函数配合find使用,那么我就可以获得指定的区域的图片
f = imread('coins.png');
f = im2bw(f);
f = imfill(f, 4, 'holes');
[g, n] = bwlabel(f);
[w, h] = size(g);
l = zeros(w, h);
sw = sqrt(n);
sh = n / sw;
for i=1:n
    [c, r] = find(g(:) == i);
    % l = zeros(w, h); % 这句话让每次读取都独立显示
    l(c) = 1;
    subplot(floor(sw), ceil(sh), i), imshow(l), title(i);
endsortrows对向量进行升序排序
unique对向量进行排序并去重
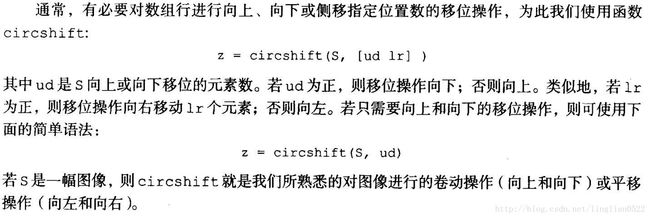
circshift对数组的行列进行移动
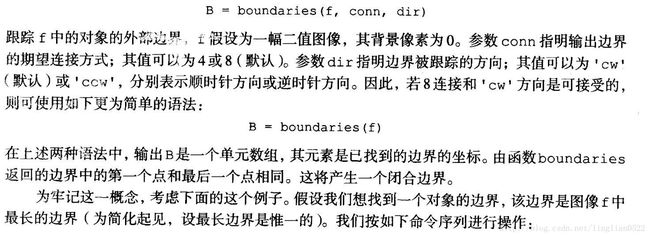
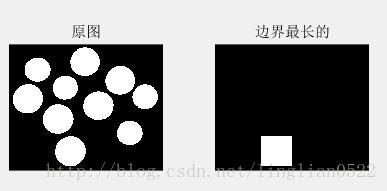
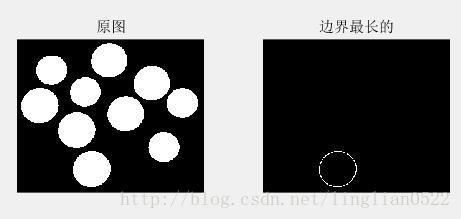
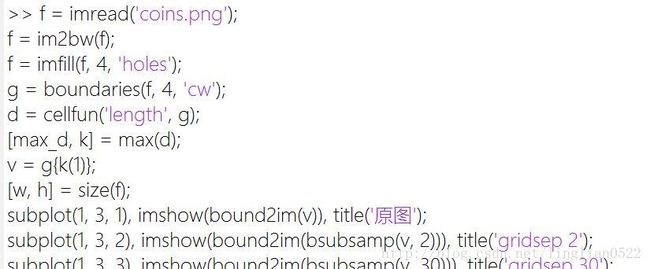
boundaries(f, conn, dir)跟踪f 的 外部边界
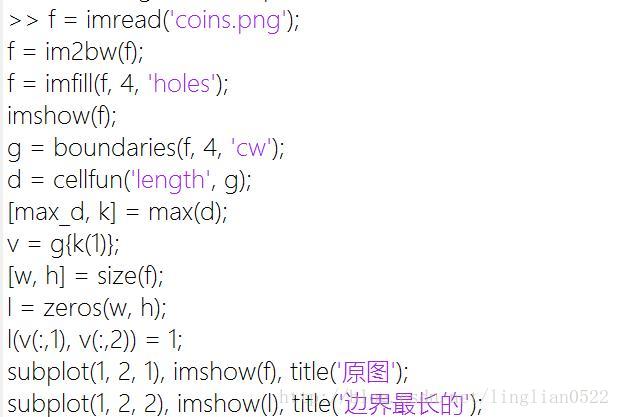
f = imread('coins.png');
f = im2bw(f);
f = imfill(f, 4, 'holes');
g = boundaries(f, 4, 'cw');
d = cellfun('length', g);
[max_d, k] = max(d);
v = g{k(1)};
[w, h] = size(f);
l = zeros(w, h);
l(v(:,1), v(:,2)) = 1;
subplot(1, 2, 1), imshow(f), title('原图');
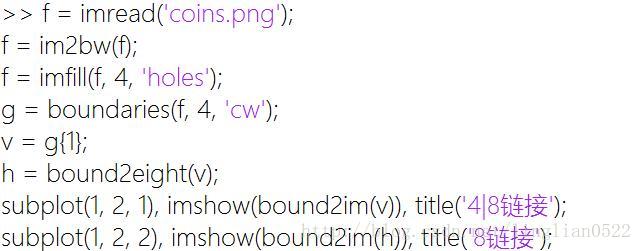
subplot(1, 2, 2), imshow(l), title('边界最长的');bound2eight(v) 去除除了8链接外的像素
f = imread('coins.png');
f = im2bw(f);
f = imfill(f, 4, 'holes');
g = boundaries(f, 4, 'cw');
v = g{1};
h = bound2eight(v);
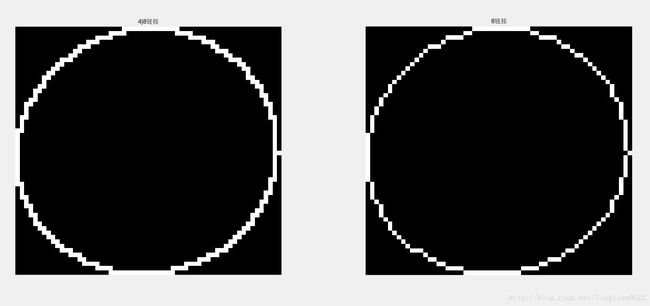
subplot(1, 2, 1), imshow(bound2im(v)), title('4|8链接');
subplot(1, 2, 2), imshow(bound2im(h)), title('8链接');bound2four(v) 去除除了4链接外的像素
该函数跟上面的差不多,要注意的就是,所有的8链接都是4链接, 但是反之不然。
bound2im(b, W, H, x, y) 在x, y 处创建一个大小为W * H 的图像,其中b是np*2的矩阵,代表坐标(值为1)
注意 这里的x/y 表示的是最小的x和y不是某个固定的坐标
用上面的例子来演示
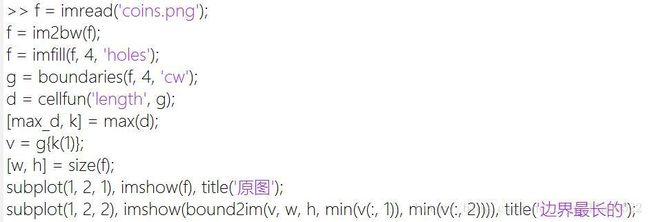
f = imread('coins.png');
f = im2bw(f);
f = imfill(f, 4, 'holes');
g = boundaries(f, 4, 'cw');
d = cellfun('length', g);
[max_d, k] = max(d);
v = g{k(1)};
[w, h] = size(f);
subplot(1, 2, 1), imshow(f), title('原图');
subplot(1, 2, 2), imshow(bound2im(v, w, h, min(v(:, 1)), min(v(:, 2)))), title('边界最长的');bsubsamp(b, gridsep) 对单一边界进行二次取样
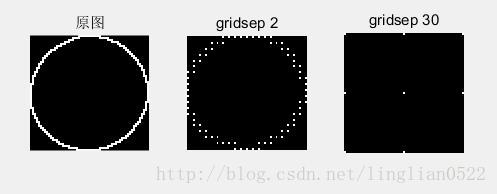
其中 gridsep 可以理解成二次取样的step数 为2 就是2个像素2个像素的跳着取样
f = imread('coins.png');
f = im2bw(f);
f = imfill(f, 4, 'holes');
g = boundaries(f, 4, 'cw');
d = cellfun('length', g);
[max_d, k] = max(d);
v = g{k(1)};
[w, h] = size(f);
subplot(1, 3, 1), imshow(bound2im(v)), title('原图');
subplot(1, 3, 2), imshow(bound2im(bsubsamp(v, 2))), title('gridsep 2');
subplot(1, 3, 3), imshow(bound2im(bsubsamp(v, 30))), title('gridsep 30');connectpoly(x, y) 将未连接的点连接起来,并且比原来更加平滑
x, y 为坐标,可以为数组,但是要一一对应
f = imread('coins.png');
f = im2bw(f);
f = imfill(f, 4, 'holes');
g = boundaries(f, 4, 'cw');
d = cellfun('length', g);
[max_d, k] = max(d);
v = g{k(1)};
[w, h] = size(f);
subplot(1, 3, 1), imshow(bound2im(v)), title('原图');
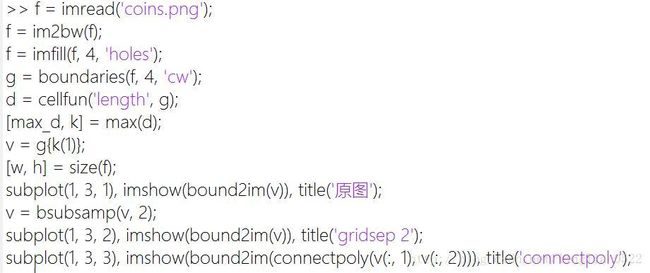
v = bsubsamp(v, 2);
subplot(1, 3, 2), imshow(bound2im(v)), title('gridsep 2');
subplot(1, 3, 3), imshow(bound2im(connectpoly(v(:, 1), v(:, 2)))), title('connectpoly');intline(x1, x2, y1, y2) 将二个点连起来,并返回这条线的向量
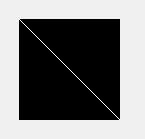
[x, y] = intline(0, 100, 0, 100);
imshow(bound2im(cat(2, x, y)));表示
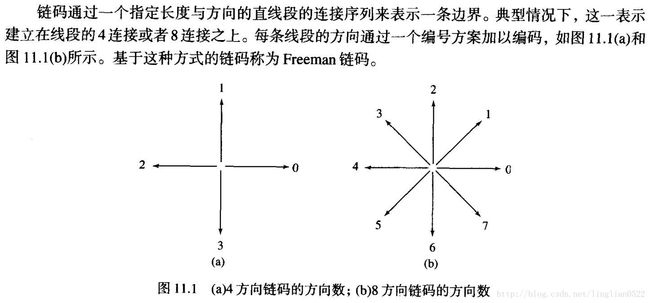
链码
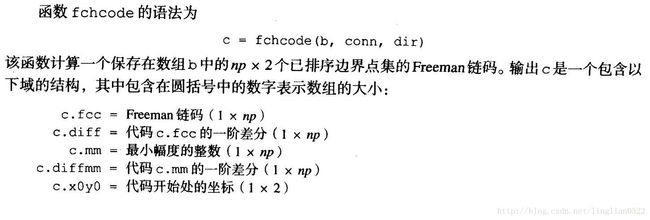
fchcode(b, conn, dir) 计算b的Freeman链码
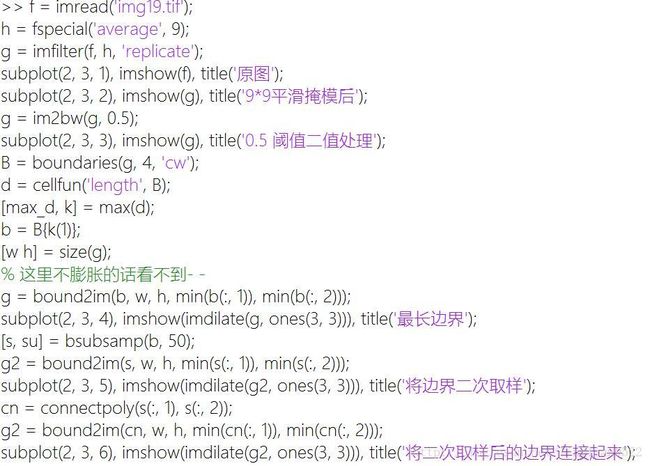
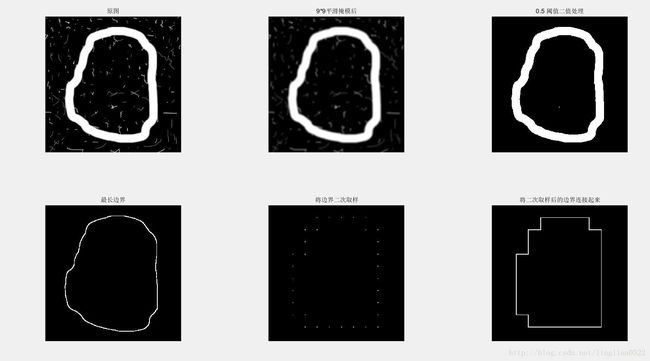
f = imread('img19.tif');
h = fspecial('average', 9);
g = imfilter(f, h, 'replicate');
subplot(2, 3, 1), imshow(f), title('原图');
subplot(2, 3, 2), imshow(g), title('9*9平滑掩模后');
g = im2bw(g, 0.5);
subplot(2, 3, 3), imshow(g), title('0.5 阈值二值处理');
B = boundaries(g, 4, 'cw');
d = cellfun('length', B);
[max_d, k] = max(d);
b = B{k(1)};
[w h] = size(g);
% 这里不膨胀的话看不到- -
g = bound2im(b, w, h, min(b(:, 1)), min(b(:, 2)));
subplot(2, 3, 4), imshow(imdilate(g, ones(3, 3))), title('最长边界');
[s, su] = bsubsamp(b, 50);
g2 = bound2im(s, w, h, min(s(:, 1)), min(s(:, 2)));
subplot(2, 3, 5), imshow(imdilate(g2, ones(3, 3))), title('将边界二次取样');
cn = connectpoly(s(:, 1), s(:, 2));
g2 = bound2im(cn, w, h, min(cn(:, 1)), min(cn(:, 2)));
subplot(2, 3, 6), imshow(imdilate(g2, ones(3, 3))), title('将二次取样后的边界连接起来');使用最小周长的多边形的多边形近似
首先要MMP和Sklansky方法
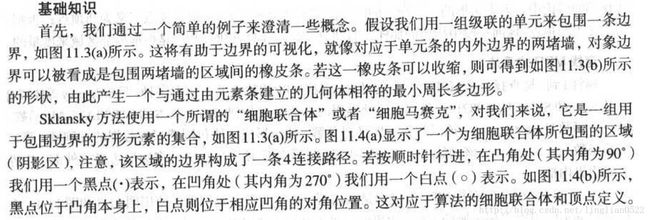
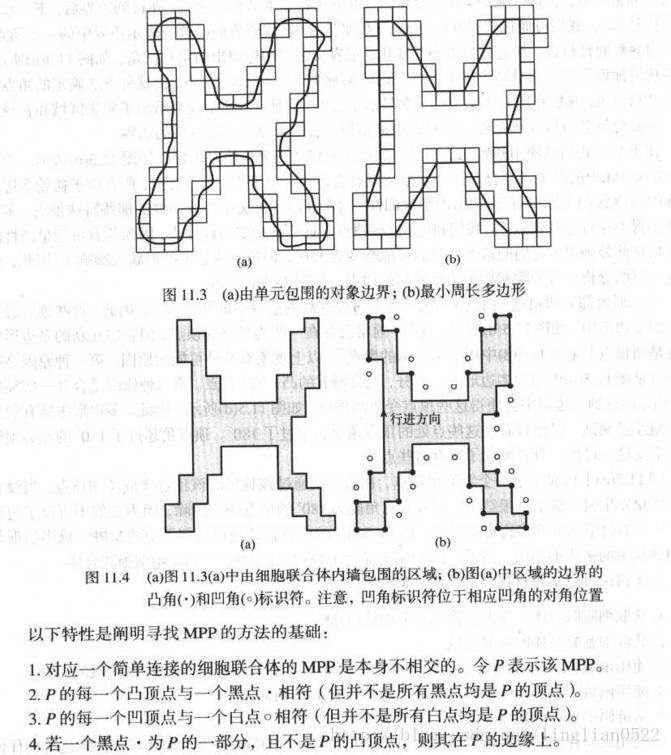
按上面所说MMP就是最小周长的多边形,SKlansky方法则根据上述四个特性(规则)来进行寻找。
接着就是寻找一个区域的MMP的步骤:

![]()
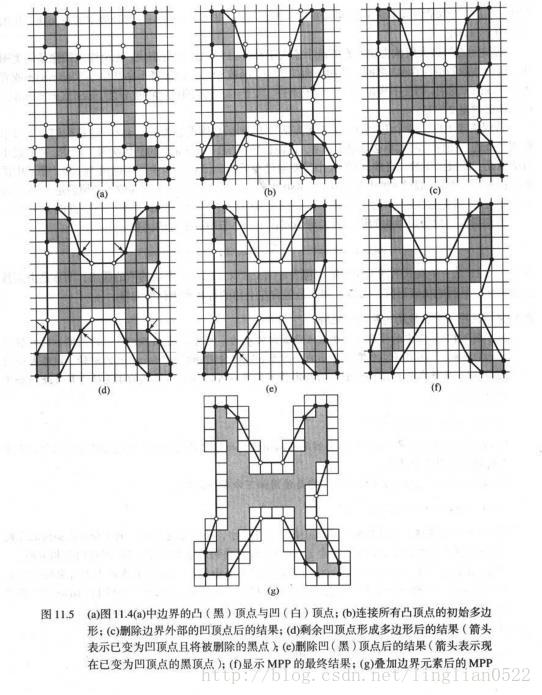
根据以上规则,得到的多边形就会越来越近似于最小周长。
按照上面的步骤,我们将学习M函数的MMP算法实现
以下二个函数将在下面一起举例
qtdecomp(B, threshold, [mindim maxdim]) 将图像分割成等大小的部分方块
注意 图片的长宽需要时2次幂
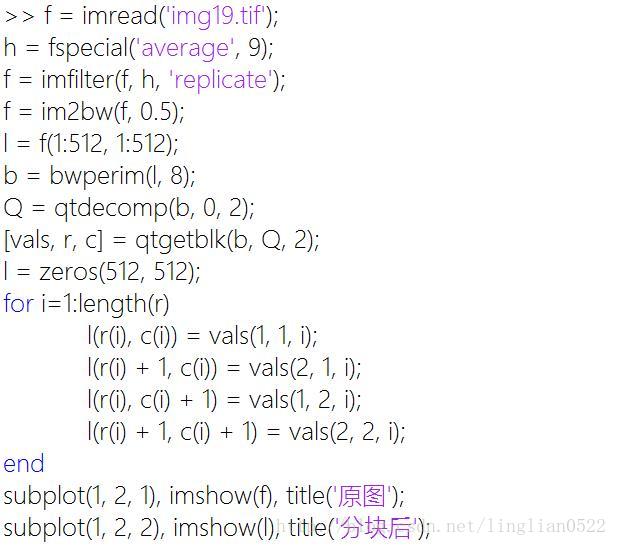
f = imread('img19.tif');
h = fspecial('average', 9);
f = imfilter(f, h, 'replicate');
f = im2bw(f, 0.5);
l = f(1:512, 1:512);
b = bwperim(l, 8);
Q = qtdecomp(b, 0, 2);
qtgetblk(B, Q, middim) 获得四叉树中的分解的块
f = imread('img19.tif');
h = fspecial('average', 9);
f = imfilter(f, h, 'replicate');
f = im2bw(f, 0.5);
l = f(1:512, 1:512);
b = bwperim(l, 8);
Q = qtdecomp(b, 0, 2);
[vals, r, c] = qtgetblk(b, Q, 2);
获得一个区域的边界的细胞墙
f = imread('img19.tif');
h = fspecial('average', 9);
f = imfilter(f, h, 'replicate');
f = im2bw(f, 0.5);
l = f(1:512, 1:512);
b = bwperim(l, 8);
Q = qtdecomp(b, 0, 2);
[vals, r, c] = qtgetblk(b, Q, 2);
l = zeros(512, 512);
for i=1:length(r)
    l(r(i), c(i)) = vals(1, 1, i);
    l(r(i) + 1, c(i)) = vals(2, 1, i);
    l(r(i), c(i) + 1) = vals(1, 2, i);
    l(r(i) + 1, c(i) + 1) = vals(2, 2, i);
end
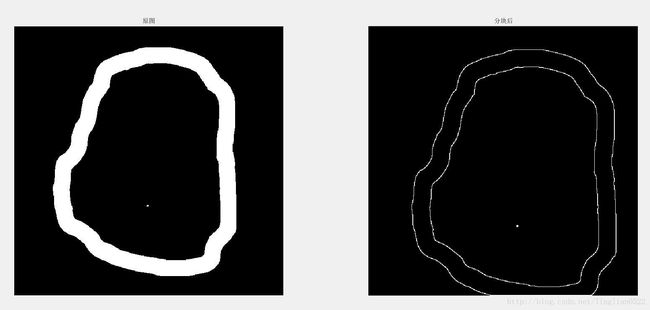
subplot(1, 2, 1), imshow(f), title('原图');
subplot(1, 2, 2), imshow(l), title('分块后');函数inpolygon(X, Y, xy, yx)
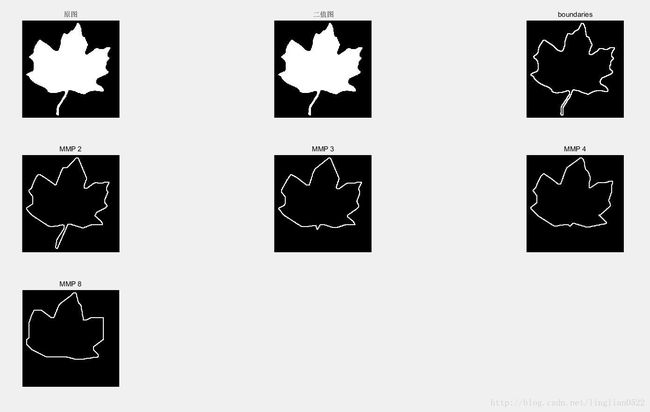
函数minerpoly(B, cellsize) 计算MMP
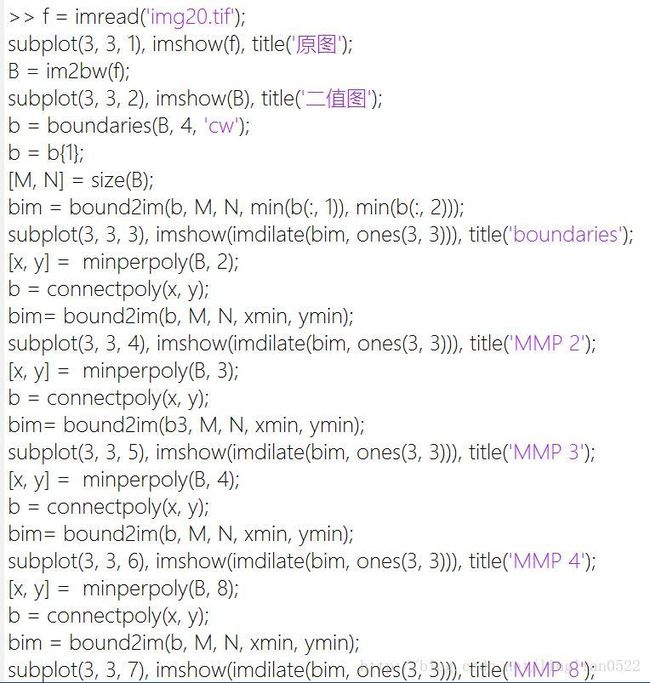
f = imread('img20.tif');
subplot(3, 3, 1), imshow(f), title('原图');
B = im2bw(f);
subplot(3, 3, 2), imshow(B), title('二值图');
b = boundaries(B, 4, 'cw');
b = b{1};
[M, N] = size(B);
bim = bound2im(b, M, N, min(b(:, 1)), min(b(:, 2)));
subplot(3, 3, 3), imshow(imdilate(bim, ones(3, 3))), title('boundaries');
[x, y] =  minperpoly(B, 2);
b = connectpoly(x, y);
bim= bound2im(b, M, N, xmin, ymin);
subplot(3, 3, 4), imshow(imdilate(bim, ones(3, 3))), title('MMP 2');
[x, y] =  minperpoly(B, 3);
b = connectpoly(x, y);
bim= bound2im(b3, M, N, xmin, ymin);
subplot(3, 3, 5), imshow(imdilate(bim, ones(3, 3))), title('MMP 3');
[x, y] =  minperpoly(B, 4);
b = connectpoly(x, y);
bim= bound2im(b, M, N, xmin, ymin);
subplot(3, 3, 6), imshow(imdilate(bim, ones(3, 3))), title('MMP 4');
[x, y] =  minperpoly(B, 8);
b = connectpoly(x, y);
bim = bound2im(b, M, N, xmin, ymin);
subplot(3, 3, 7), imshow(imdilate(bim, ones(3, 3))), title('MMP 8');标记
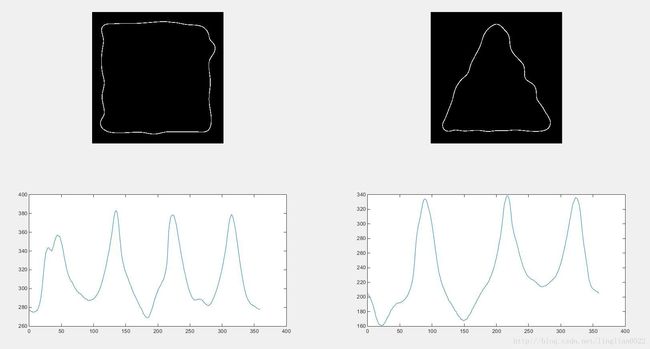
标记是边界的一维函数的表示,主要思想就是将边界简化为一维函数,使其更加容易描述。
signature(b, x0, y0) 用于查找给定边界的标记
该函数的b需要必须是像素宽的边界,如boundaries获得的边界

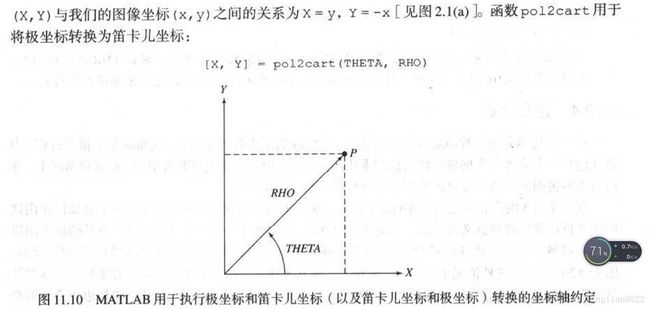
cart2pol(X, Y) 将笛卡尔坐标转换为极坐标
标记
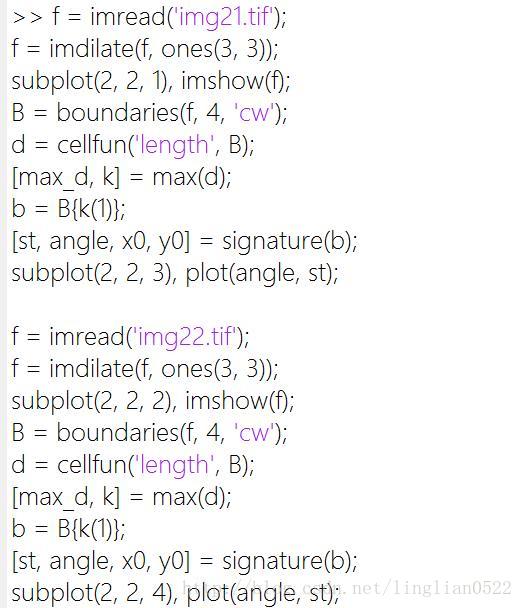
f = imread('img21.tif');
f = imdilate(f, ones(3, 3));
subplot(2, 2, 1), imshow(f);
B = boundaries(f, 4, 'cw');
d = cellfun('length', B);
[max_d, k] = max(d);
b = B{k(1)};
[st, angle, x0, y0] = signature(b);
subplot(2, 2, 3), plot(angle, st);

f = imread('img22.tif');
f = imdilate(f, ones(3, 3));
subplot(2, 2, 2), imshow(f);
B = boundaries(f, 4, 'cw');
d = cellfun('length', B);
[max_d, k] = max(d);
b = B{k(1)};
[st, angle, x0, y0] = signature(b);
subplot(2, 2, 4), plot(angle, st);边界片段
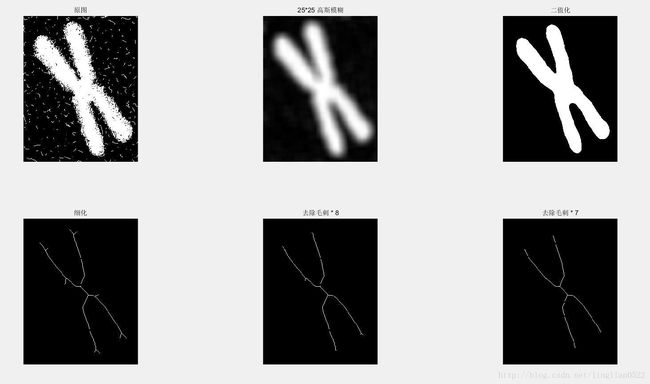
骨骼
将一个结构细化的过程称为骨骼化。
bwmorph(f, ‘skel’, Inf) 骨骼化,在形态学中有讲过
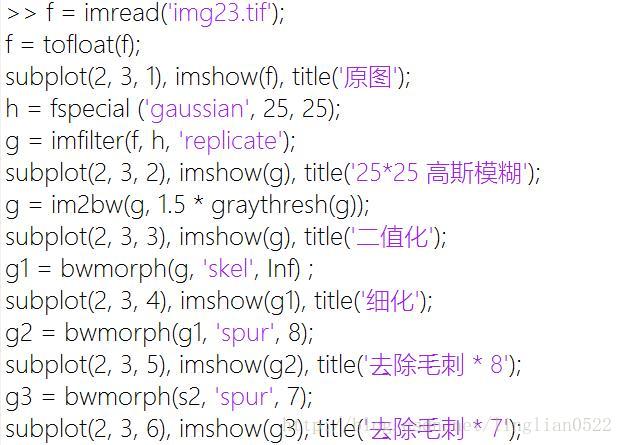
f = imread('img23.tif');
f = tofloat(f);
subplot(2, 3, 1), imshow(f), title('原图');
h = fspecial ('gaussian', 25, 25);
g = imfilter(f, h, 'replicate');
subplot(2, 3, 2), imshow(g), title('25*25 高斯模糊');
g = im2bw(g, 1.5 * graythresh(g));
subplot(2, 3, 3), imshow(g), title('二值化');
g1 = bwmorph(g, 'skel', Inf) ;
subplot(2, 3, 4), imshow(g1), title('细化');
g2 = bwmorph(g1, 'spur', 8);
subplot(2, 3, 5), imshow(g2), title('去除毛刺 * 8');
g3 = bwmorph(s2, 'spur', 7);
subplot(2, 3, 6), imshow(g3), title('去除毛刺 * 7');
