二手车预测part1
数据集的探索(EDA)
- 主要使用工具:pandas, numpy, matplotlib, seaborn, missingno
- 总体流程
- 第一步:数据的导入
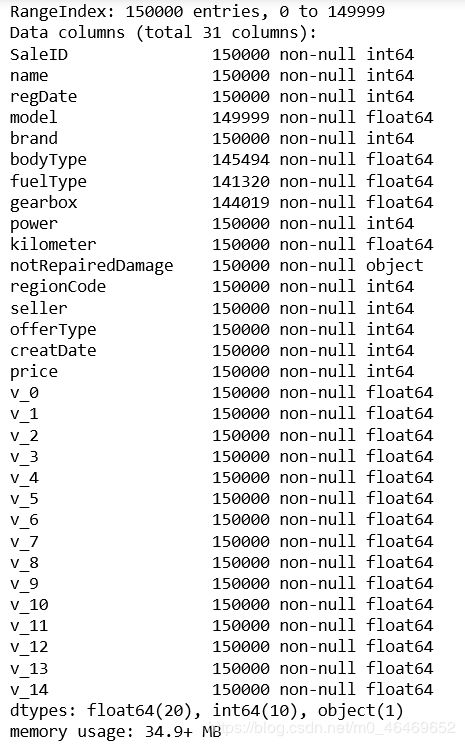
- 第二步:查看数据的基本信息
- 对无关的columns进行处理
- 第三步:对columns进行categories features和numerical features的分类
- 数据特征的相关性分析
- 类别特征的可视化
主要使用工具:pandas, numpy, matplotlib, seaborn, missingno
总体流程
第一步:数据的导入
train_data=pd.read_csv('D:/天池数据集/二手车/used_car_train_20200313.csv',engine='python',sep=' ')
test_data=pd.read_csv('D:/天池数据集/二手车/used_car_testA_20200313.csv',engine='python',sep=' ')
train_data.head()
第二步:查看数据的基本信息
train_data.describe()
train_data.info()
print(train_data.shape)
print(test_data.shape)
![]()
###对缺失值进行操作
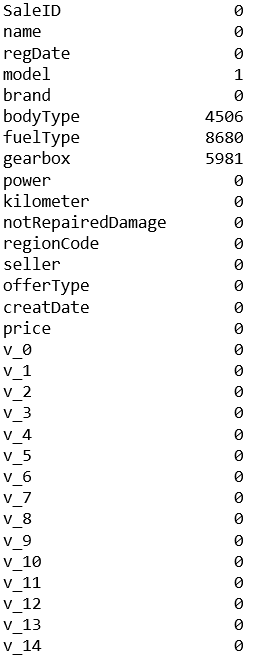
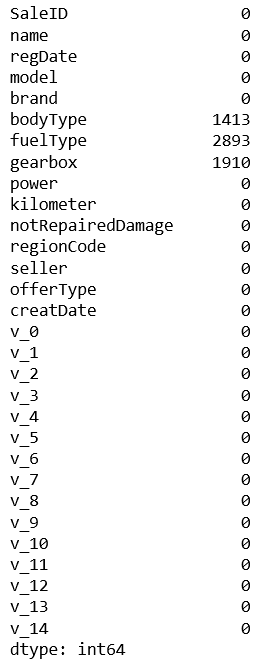
查看训练数据集每个column的缺失值总数
train_data.isnull().sum()
test_data.isnull().sum()
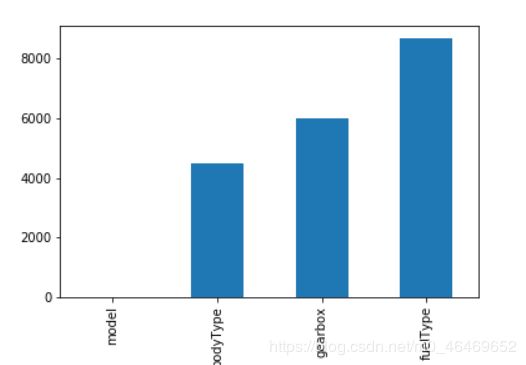
missing=train_data.isnull().sum()
missing=missing[missing>0]
missing.sort_values(inplace=True)
missing.plot.bar()
msno.matrix(train_data)
msno.matrix(test_data)
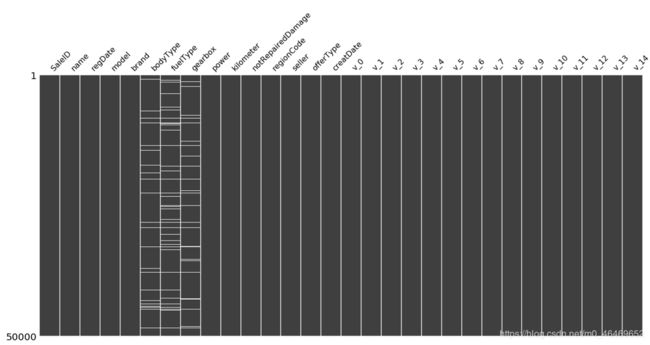
由于只有notRepairedDamage这一列是object型,所以单独先对这个column的值进行填充
首先查看这一列的缺失值情况
train_data['notRepairedDamage'].value_counts()
train_data['notRepairedDamage'].replace('-',np.nan,inplace=True)
train_data['notRepairedDamage'].value_counts()
对无关的columns进行处理
由于seller列和offerType列属性严重倾斜,所以进行删除
del train_data["seller"]
del train_data["offerType"]
del test_data["seller"]
del test_data["offerType"]
##查看price列的分布情况
price.value_counts()
再查看price和哪个分布最吻合
import scipy.stats as st
y = train_data['price']
plt.figure(1); plt.title('Johnson SU')
sns.distplot(y, kde=False, fit=st.johnsonsu)
plt.figure(2); plt.title('Normal')
sns.distplot(y, kde=False, fit=st.norm)
plt.figure(3); plt.title('Log Normal')
sns.distplot(y, kde=False, fit=st.lognorm)
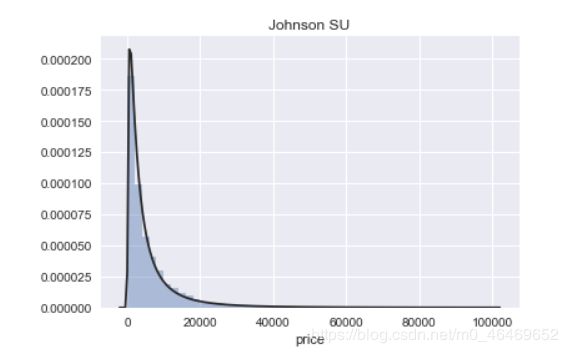
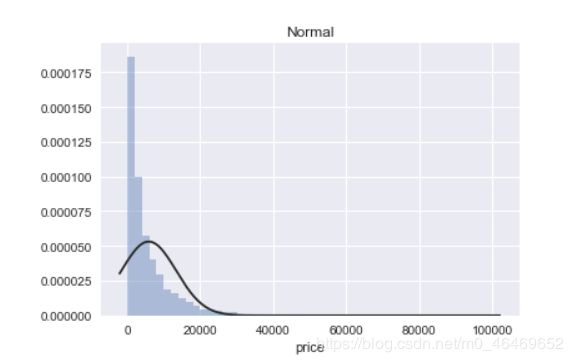
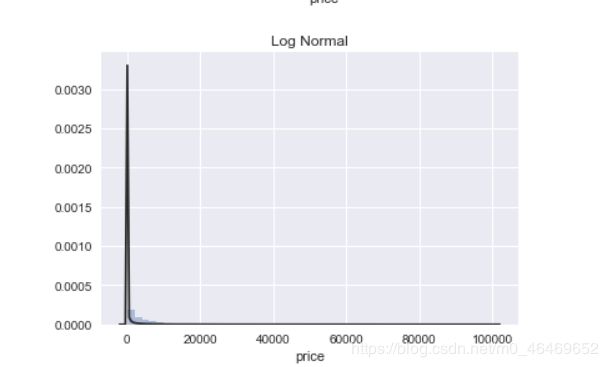
seaborn中的distplot主要功能是绘制单变量的直方图,且还可以在直方图的基础上施加kdeplot和rugplot的部分内容,是一个功能非常强大且实用的函数,其主要参数如下:
a:一维数组形式,传入待分析的单个变量
bins:int型变量,用于确定直方图中显示直方的数量,默认为None,这时bins的具体个数由Freedman-Diaconis准则来确定
hist:bool型变量,控制是否绘制直方图,默认为True
kde:bool型变量,控制是否绘制核密度估计曲线,默认为True
rug:bool型变量,控制是否绘制对应rugplot的部分,默认为False
fit:传入scipy.stats中的分布类型,用于在观察变量上抽取相关统计特征来强行拟合指定的分布,默认为None,即不进行拟合
hist_kws,kde_kws,rug_kws:这几个变量都接受字典形式的输入,键值对分别对应各自原生函数中的参数名称与参数值,在下文中会有示例
color:用于控制除了fit部分拟合出的曲线之外的所有对象的色彩
vertical:bool型,控制是否颠倒x-y轴,默认为False,即不颠倒
norm_hist:bool型变量,用于控制直方图高度代表的意义,为True直方图高度表示对应的密度,为False时代表的是对应的直方区间内记录值个数,默认为False
label:控制图像中的图例标签显示内容
图中的Johnson SU为约翰逊分布,是一种经过约翰变换后服从正态分布概率的随机变量的概率分布;normal为正态分布;lognormal为对数正态分布,对数正态分布从短期来看,与正态分布非常接近。但长期来看,对数正态分布向上分布的数值更多一些。
通过结果我们可以看到,无界约翰逊分布对price的分布情况拟合最好。
再对预测值进行峰度于偏度进行分析
sns.distplot(train_data['price']);
print("Skewness: %f" % train_data['price'].skew())
print("Kurtosis: %f" % train_data['price'].kurt())
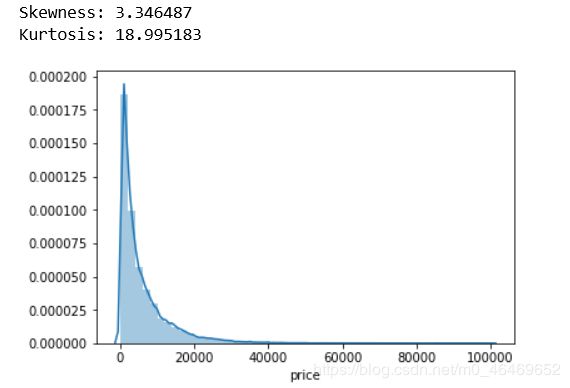
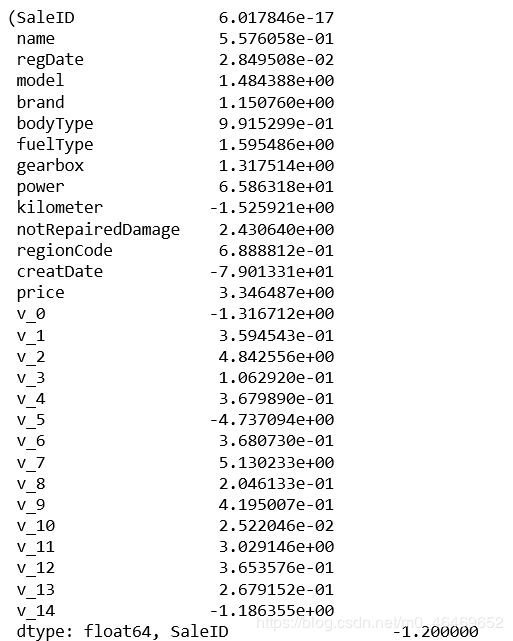
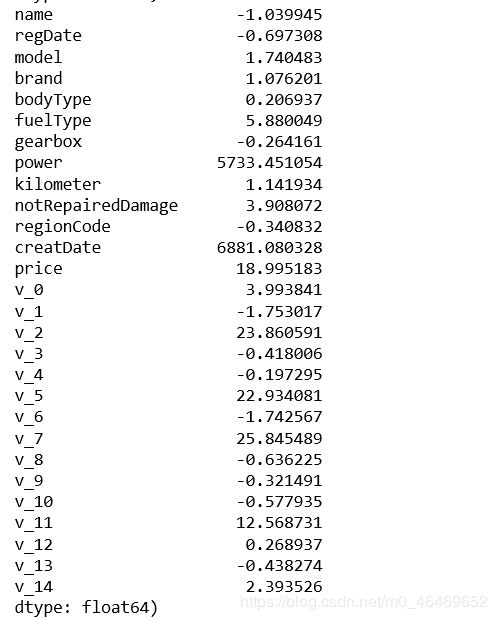
查看训练集各column得偏度和峰度
偏度(skewness)也称为偏态、偏态系数,是统计数据分布偏斜方向和程度的度量,是统计数据分布非对称程度的数字特征。
-峰度(Kurtosis)与偏度类似,是描述总体中所有取值分布形态陡缓程度的统计量。这个统计量需要与正态分布相比较,峰度为0表示该总体数据分布与正态分布的陡缓程度相同;峰度大于0表示该总体数据分布与正态分布相比较为陡峭,为尖顶峰;峰度小于0表示该总体数据分布与正态分布相比较为平坦,为平顶峰。峰度的绝对值数值越大表示其分布形态的陡缓程度与正态分布的差异程度越大。
train_data.skew(), train_data.kurt()
sns.distplot(train_data.skew(),color='blue',axlabel ='Skewness')
sns.distplot(train_data.kurt(),color='orange',axlabel ='Kurtness')
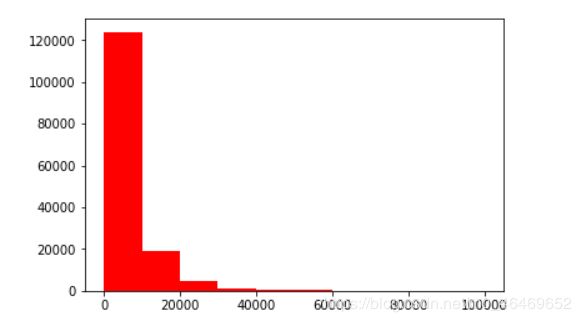
plt.hist(train_data['price'],orientation='vertical',histtype='bar',color='red')
plt.show
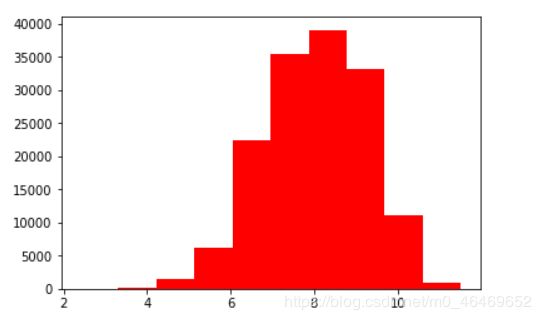
plt.hist(np.log(train_data['price']),orientation='vertical',histtype='bar',color='red')
plt.show
第三步:对columns进行categories features和numerical features的分类
numeric_features=['power','kilometer','v_0', 'v_1', 'v_2', 'v_3', 'v_4', 'v_5', 'v_6', 'v_7', 'v_8',
       'v_9', 'v_10', 'v_11', 'v_12', 'v_13', 'v_14'
categorical_features=[ 'name', 'model', 'brand', 'bodyType', 'fuelType',
       'gearbox',  'notRepairedDamage', 'regionCode']
在这里两个日期feature并未分类。
接下来对训练集和测试集中的类别特征进行统计
for i in categorical_features:
    print(i+'的特征值分布')
    print(i+'有%i个不同的特征值'%train_data[i].nunique())
    print(train_data[i].value_counts())
name的特征值分布
name有99662个不同的特征值
708 282
387 282
55 280
1541 263
203 233
53 221
713 217
290 197
1186 184
911 182
2044 176
1513 160
1180 158
631 157
893 153
2765 147
473 141
1139 137
1108 132
444 129
306 127
2866 123
2402 116
533 114
1479 113
422 113
4635 110
725 110
964 109
1373 104
…
89083 1
95230 1
164864 1
173060 1
179207 1
181256 1
185354 1
25564 1
19417 1
189324 1
162719 1
191373 1
193422 1
136082 1
140180 1
144278 1
146327 1
148376 1
158621 1
1404 1
15319 1
46022 1
64463 1
976 1
3025 1
5074 1
7123 1
11221 1
13270 1
174485 1
Name: name, Length: 99662, dtype: int64
model的特征值分布
model有248个不同的特征值
0.0 11762
19.0 9573
4.0 8445
1.0 6038
29.0 5186
48.0 5052
40.0 4502
26.0 4496
8.0 4391
31.0 3827
13.0 3762
17.0 3121
65.0 2730
49.0 2608
46.0 2454
30.0 2342
44.0 2195
5.0 2063
10.0 2004
21.0 1872
73.0 1789
11.0 1775
23.0 1696
22.0 1524
69.0 1522
63.0 1469
7.0 1460
16.0 1349
88.0 1309
66.0 1250
…
141.0 37
133.0 35
216.0 30
202.0 28
151.0 26
226.0 26
231.0 23
234.0 23
233.0 20
198.0 18
224.0 18
227.0 17
237.0 17
220.0 16
230.0 16
239.0 14
223.0 13
236.0 11
241.0 10
232.0 10
229.0 10
235.0 7
246.0 7
243.0 4
244.0 3
245.0 2
209.0 2
240.0 2
242.0 2
247.0 1
Name: model, Length: 248, dtype: int64
brand的特征值分布
brand有40个不同的特征值
0 31480
4 16737
14 16089
10 14249
1 13794
6 10217
9 7306
5 4665
13 3817
11 2945
3 2461
7 2361
16 2223
8 2077
25 2064
27 2053
21 1547
15 1458
19 1388
20 1236
12 1109
22 1085
26 966
30 940
17 913
24 772
28 649
32 592
29 406
37 333
2 321
31 318
18 316
36 228
34 227
33 218
23 186
35 180
38 65
39 9
Name: brand, dtype: int64
bodyType的特征值分布
bodyType有8个不同的特征值
0.0 41420
1.0 35272
2.0 30324
3.0 13491
4.0 9609
5.0 7607
6.0 6482
7.0 1289
Name: bodyType, dtype: int64
fuelType的特征值分布
fuelType有7个不同的特征值
0.0 91656
1.0 46991
2.0 2212
3.0 262
4.0 118
5.0 45
6.0 36
Name: fuelType, dtype: int64
gearbox的特征值分布
gearbox有2个不同的特征值
0.0 111623
1.0 32396
Name: gearbox, dtype: int64
notRepairedDamage的特征值分布
notRepairedDamage有2个不同的特征值
0.0 111361
1.0 14315
Name: notRepairedDamage, dtype: int64
regionCode的特征值分布
regionCode有7905个不同的特征值
419 369
764 258
125 137
176 136
462 134
428 132
24 130
1184 130
122 129
828 126
70 125
827 120
207 118
1222 117
2418 117
85 116
2615 115
2222 113
759 112
188 111
1757 110
1157 109
2401 107
1069 107
3545 107
424 107
272 107
451 106
450 105
129 105
…
6324 1
7372 1
7500 1
8107 1
2453 1
7942 1
5135 1
6760 1
8070 1
7220 1
8041 1
8012 1
5965 1
823 1
7401 1
8106 1
5224 1
8117 1
7507 1
7989 1
6505 1
6377 1
8042 1
7763 1
7786 1
6414 1
7063 1
4239 1
5931 1
7267 1
Name: regionCode, Length: 7905, dtype: int64
for i in numerical_features:
    print(i+'的特征值分布')
    print(i+'有%i个不同的特征值'%test_data[i].nunique())
    print(test_data[i].value_counts())
power的特征值分布
power有445个不同的特征值
0 4195
75 3226
150 2180
60 2164
140 1949
…
1000 1
392 1
296 1
375 1
6045 1
Name: power, Length: 445, dtype: int64
kilometer的特征值分布
kilometer有13个不同的特征值
15.0 32189
12.5 5346
10.0 2106
9.0 1791
8.0 1523
7.0 1408
6.0 1218
5.0 1093
4.0 898
3.0 849
2.0 717
0.5 616
1.0 246
Name: kilometer, dtype: int64
v_0的特征值分布
v_0有49186个不同的特征值
48.307770 10
47.823716 9
47.730567 8
47.973963 7
46.949081 6
…
46.709371 1
42.285412 1
45.908487 1
44.795087 1
44.702754 1
Name: v_0, Length: 49186, dtype: int64
v_1的特征值分布
v_1有49186个不同的特征值
2.366464 10
3.678694 9
-3.276149 8
3.540994 7
-3.245133 6
…
-3.197110 1
2.525392 1
-3.267695 1
5.267298 1
3.956439 1
Name: v_1, Length: 49186, dtype: int64
v_2的特征值分布
v_2有49186个不同的特征值
1.160401 10
1.016142 9
0.790099 8
1.079664 7
0.935597 6
…
-1.398851 1
0.964469 1
0.731882 1
0.975749 1
0.836905 1
Name: v_2, Length: 49186, dtype: int64
v_3的特征值分布
v_3有49186个不同的特征值
-1.641052 10
-1.345497 9
-2.826999 8
-1.554670 7
-1.797526 6
…
-0.367449 1
0.656751 1
-2.558057 1
-3.799204 1
-0.631927 1
Name: v_3, Length: 49186, dtype: int64
v_4的特征值分布
v_4有49186个不同的特征值
0.940788 10
-0.481574 9
-0.162278 8
-0.385561 7
0.487992 6
…
-0.680404 1
-0.901899 1
0.831013 1
0.710871 1
-1.266948 1
Name: v_4, Length: 49186, dtype: int64
v_5的特征值分布
v_5有47788个不同的特征值
0.000000 1408
0.251404 10
0.261729 9
0.259405 8
0.261172 7
…
0.260492 1
0.260519 1
0.266540 1
0.264197 1
0.252388 1
Name: v_5, Length: 47788, dtype: int64
v_6的特征值分布
v_6有37624个不同的特征值
0.000000 11706
0.082237 10
0.100182 9
0.000908 8
0.098281 7
…
0.094475 1
0.093150 1
0.001200 1
0.000267 1
0.103738 1
Name: v_6, Length: 37624, dtype: int64
v_7的特征值分布
v_7有47355个不同的特征值
0.000000 1855
0.150080 10
0.147069 9
0.142647 8
0.147553 7
…
0.171847 1
0.095100 1
0.147476 1
0.034757 1
0.037033 1
Name: v_7, Length: 47355, dtype: int64
v_8的特征值分布
v_8有48634个不同的特征值
0.000000 566
0.082606 10
0.071799 9
0.108396 8
0.075273 7
…
0.086602 1
0.107524 1
0.061906 1
0.037238 1
0.102028 1
Name: v_8, Length: 48634, dtype: int64
v_9的特征值分布
v_9有48063个不同的特征值
0.000000 1128
0.088695 10
0.043857 9
0.051700 8
0.046122 7
…
0.052563 1
0.028928 1
0.011907 1
0.061394 1
0.055948 1
Name: v_9, Length: 48063, dtype: int64
v_10的特征值分布
v_10有49186个不同的特征值
-3.625918 10
-4.616005 9
1.392127 8
-4.561606 7
2.329386 6
…
1.549942 1
-6.097504 1
-1.968280 1
1.260234 1
2.269238 1
Name: v_10, Length: 49186, dtype: int64
v_11的特征值分布
v_11有49186个不同的特征值
-0.621775 10
0.123947 9
-3.271947 8
-0.014630 7
-1.361266 6
…
-1.609568 1
0.838801 1
0.471485 1
1.363000 1
0.622981 1
Name: v_11, Length: 49186, dtype: int64
v_12的特征值分布
v_12有49186个不同的特征值
3.086576 10
2.470123 9
4.129080 8
2.718381 7
2.220574 6
…
2.848289 1
-4.921279 1
-2.587100 1
2.175579 1
4.464210 1
Name: v_12, Length: 49186, dtype: int64
v_13的特征值分布
v_13有49186个不同的特征值
0.165461 10
-0.667797 9
-0.088135 8
-0.548303 7
-0.889523 6
…
-0.382532 1
-1.662551 1
-1.139065 1
0.671480 1
-0.715059 1
Name: v_13, Length: 49186, dtype: int64
v_14的特征值分布
v_14有49186个不同的特征值
-2.192635 10
0.729287 9
0.805444 8
0.829063 7
0.003015 6
…
1.295508 1
1.158644 1
-0.338013 1
0.229028 1
0.772736 1
Name: v_14, Length: 49186, dtype: int64
##数字特征分析
把price加入数字特征列表中
numeric_features.append('price')
price_numeric = train_data[numeric_features]
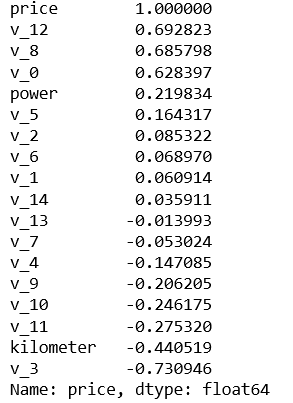
correlation=price_numeric.corr()
correlation['price'].sort_values(ascending=False)
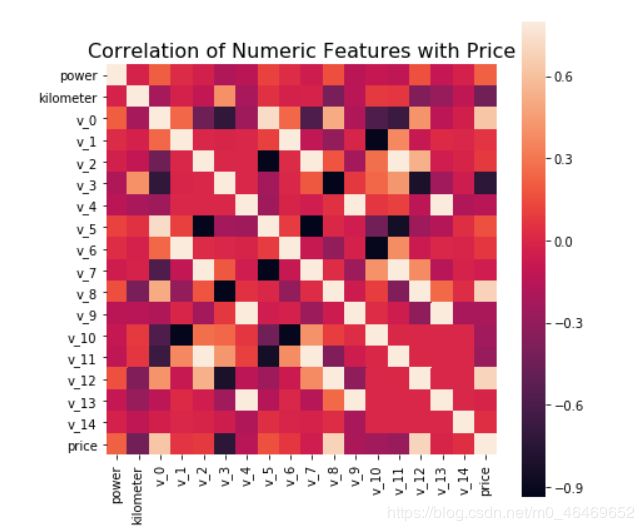
数据特征的相关性分析
f , ax = plt.subplots(figsize = (7, 7))
plt.title('Correlation of Numeric Features with Price',y=1,size=16)
sns.heatmap(correlation,square = True, vmax=0.8)
del price_numeric['price']
对numerical_features数据集进行偏度和峰度分析
for col in numeric_features:
    print(col)
    print(train_data[col].skew())
    print(train_data[col].kurt())
power
65.8631778705
5733.45105438
kilometer
-1.52592136471
1.14193418781
v_0
-1.31671232461
3.99384104899
v_1
0.359454287173
-1.75301699639
v_2
4.84255590371
23.8605910214
v_3
0.106292040463
-0.41800588767
v_4
0.367988970241
-0.197295243192
v_5
-4.73709390916
22.9340810629
v_6
0.368073042062
-1.74256665434
v_7
5.13023301855
25.8454892939
v_8
0.204613257012
-0.636225257561
v_9
0.419500749745
-0.321491178898
v_10
0.0252204641241
-0.577935063536
v_11
3.02914581292
12.5687314728
v_12
0.365357601084
0.268937389225
v_13
0.267915191449
-0.438274022657
v_14
-1.1863553246
2.3935259341
price
3.34648676264
18.9951833556
每个数字特征的分布可视化
使用melt()函数将列名转换成列数据
再使用FaceGrid和map绘制出每个属性的分布图
f = pd.melt(train_data, value_vars=numeric_features)
g = sns.FacetGrid(f, col="variable", col_wrap=2, sharex=False, sharey=False)
g = g.map(sns.distplot, "value")
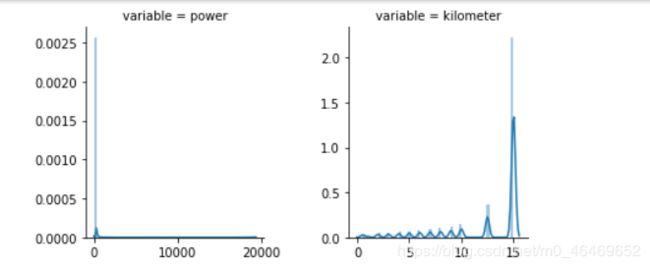
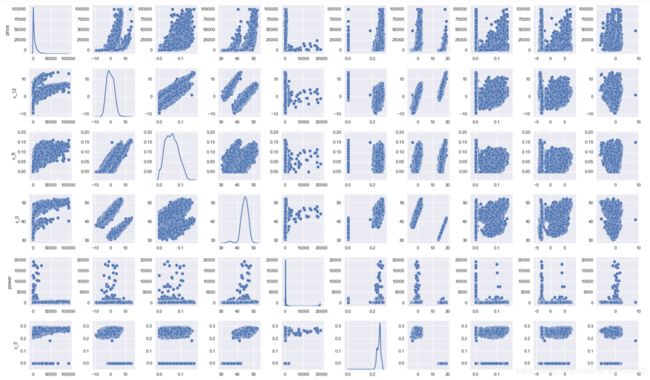
使用paiplot展示两两属性之间的关系,对角线是单个属性的分布图
sns.set()
columns = ['price', 'v_12', 'v_8' , 'v_0', 'power', 'v_5', 'v_2', 'v_6', 'v_1', 'v_14']
sns.pairplot(train_data[columns],size = 2 ,kind ='scatter',diag_kind='kde')
plt.show()
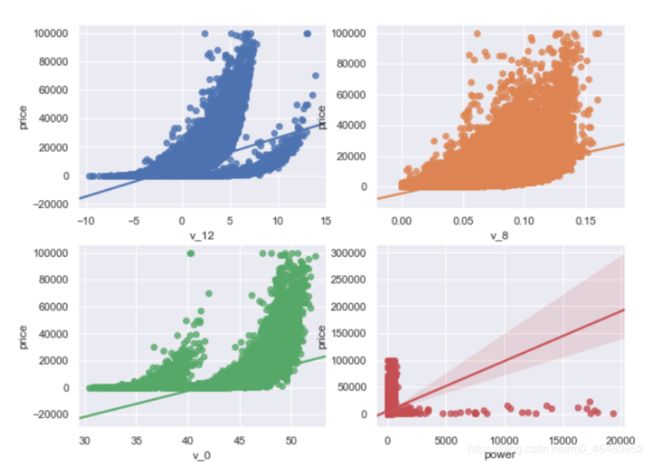
fig, ((ax1, ax2), (ax3, ax4), (ax5, ax6), (ax7, ax8), (ax9, ax10)) = plt.subplots(nrows=5, ncols=2)
# ['v_12', 'v_8' , 'v_0', 'power', 'v_5', 'v_2', 'v_6', 'v_1', 'v_14']
v_12_scatter_plot = pd.concat([Y_train,train_data['v_12']],axis = 1)
sns.regplot(x='v_12',y = 'price', data = v_12_scatter_plot,scatter= True, fit_reg=True, ax=ax1)
v_8_scatter_plot = pd.concat([Y_train,train_data['v_8']],axis = 1)
sns.regplot(x='v_8',y = 'price',data = v_8_scatter_plot,scatter= True, fit_reg=True, ax=ax2)
v_0_scatter_plot = pd.concat([Y_train,train_data['v_0']],axis = 1)
sns.regplot(x='v_0',y = 'price',data = v_0_scatter_plot,scatter= True, fit_reg=True, ax=ax3)
power_scatter_plot = pd.concat([Y_train,train_data['power']],axis = 1)
sns.regplot(x='power',y = 'price',data = power_scatter_plot,scatter= True, fit_reg=True, ax=ax4)
v_5_scatter_plot = pd.concat([Y_train,train_data['v_5']],axis = 1)
sns.regplot(x='v_5',y = 'price',data = v_5_scatter_plot,scatter= True, fit_reg=True, ax=ax5)
v_2_scatter_plot = pd.concat([Y_train,train_data['v_2']],axis = 1)
sns.regplot(x='v_2',y = 'price',data = v_2_scatter_plot,scatter= True, fit_reg=True, ax=ax6)
v_6_scatter_plot = pd.concat([Y_train,train_data['v_6']],axis = 1)
sns.regplot(x='v_6',y = 'price',data = v_6_scatter_plot,scatter= True, fit_reg=True, ax=ax7)
v_1_scatter_plot = pd.concat([Y_train,train_data['v_1']],axis = 1)
sns.regplot(x='v_1',y = 'price',data = v_1_scatter_plot,scatter= True, fit_reg=True, ax=ax8)
v_14_scatter_plot = pd.concat([Y_train,train_data['v_14']],axis = 1)
sns.regplot(x='v_14',y = 'price',data = v_14_scatter_plot,scatter= True, fit_reg=True, ax=ax9)
v_13_scatter_plot = pd.concat([Y_train,train_data['v_13']],axis = 1)
sns.regplot(x='v_13',y = 'price',data = v_13_scatter_plot,scatter= True, fit_reg=True, ax=ax10)
for i in categorical_features:
    print(train_data[i].nunique())
categorical_features
99662
248
40
8
7
2
2
7905
类别特征的可视化
类别特征箱型图可视化
由于name和regionCode特征过于稀疏,所以选取其他类别特征进行可视化
for c in categorical_features:
    train_data[c] = train_data[c].astype('category')
    if train_data[c].isnull().any():
        train_data[c] = train_data[c].cat.add_categories(['MISSING'])
        train_data[c] = train_data[c].fillna('MISSING')
def boxplot(x, y, **kwargs):
    sns.boxplot(x=x, y=y)
    x=plt.xticks(rotation=90)
f = pd.melt(train_data, id_vars=['price'], value_vars=categorical_features)
g = sns.FacetGrid(f, col="variable", col_wrap=2, sharex=False, sharey=False, size=5)
g = g.map(boxplot, "value", "price")
catg_list = categorical_features
target = 'price'
for catg in catg_list :
    sns.violinplot(x=catg, y=target, data=train_data)
    plt.show()
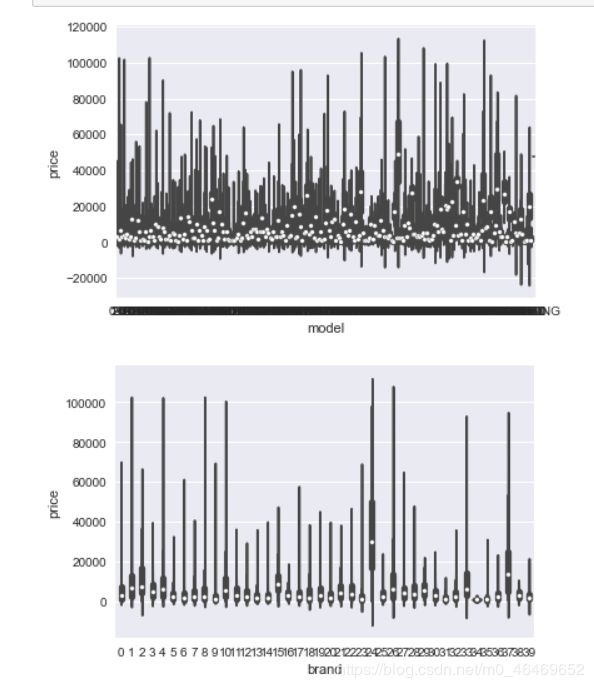
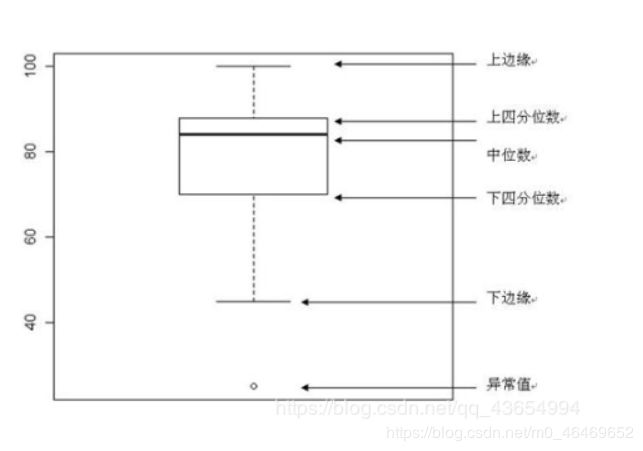
①白点代表中位数Q2(即数据中有一半大于中位数,在其之上,另一半小于中位数,在其之下);
②黑色矩形是下四分位数到上四分位数的范围,矩形上边缘为上四分位数Q3,代表数据中有四分之一的数目大于上四分位数,下边缘为下四分位数Q1,代表数据中有四分之一的数目小于下四分位数;
四分位间距IQR(上四分位数和下四分为数间距)长短代表非异常数据的分散和对称程度,长则分散,短则集中;
③上下贯穿小提琴图的黑线代表最小非异常值min到最大非异常值max的区间,线上下端分别代表上限和下限,超出此范围为异常数据 ;
④黑色矩形外部形状为核密度估计,图形纵轴方向长度代表数据弥散程度,横轴方向长度代表在某纵坐标位置数据分布量。
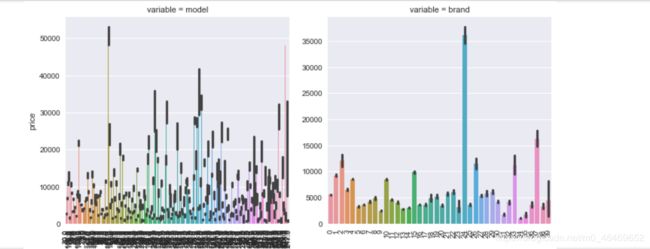
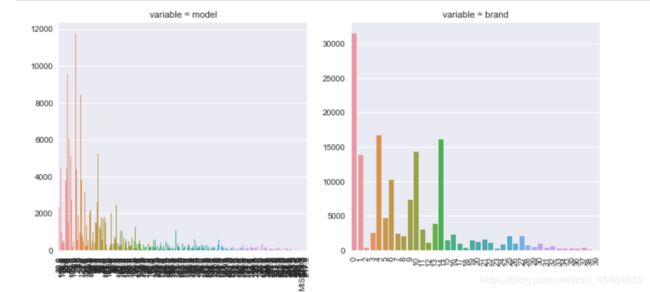
##每个类别的频数可视化
def bar_plot(x, y, **kwargs):
    sns.barplot(x=x, y=y)
    x=plt.xticks(rotation=90)
f = pd.melt(train_data, id_vars=['price'], value_vars=categorical_features)
g = sns.FacetGrid(f, col="variable", col_wrap=2, sharex=False, sharey=False, size=5)
g = g.map(bar_plot, "value", "price")
def count_plot(x, **kwargs):
    sns.countplot(x=x)
    x=plt.xticks(rotation=90)
f = pd.melt(train_data, value_vars=categorical_features)
g = sns.FacetGrid(f, col="variable", col_wrap=2, sharex=False, sharey=False, size=5)
g = g.map(count_plot, "value")


