1、引入头文件
import numpy as np
import matplotlib as mpl
import matplotlib.pyplot as plt
import pandas as pd
import warnings
import sklearn
from sklearn.linear_model import LinearRegression, LassoCV, RidgeCV, ElasticNetCV
from sklearn.preprocessing import PolynomialFeatures#数据预处理,标准化
from sklearn.pipeline import Pipeline
from sklearn.linear_model.coordinate_descent import ConvergenceWarning
2、设置字符集,防止中文乱码,拦截异常
## 设置字符集,防止中文乱码
mpl.rcParams['font.sans-serif']=[u'simHei']
mpl.rcParams['axes.unicode_minus']=False
## 拦截异常
warnings.filterwarnings(action = 'ignore', category=ConvergenceWarning)
3、创建模拟数据
## 使得随机数据可预测,即只要seed的值一样,后续生成的随机数都一样。
np.random.seed(100)
#显示方式设置,每行的字符数用于插入换行符,是否使用科学计数法
np.set_printoptions(linewidth=1000, suppress=True)
N = 10
## linspace:x从0~6之间等步长取N个数
## 由于seed(10),固定了一种随机方案,np.random.randn(N)每次结果都一致
x = np.linspace(0, 6, N) + np.random.randn(N)
y = 1.8*x**3 + x**2 - 14*x - 7 + np.random.randn(N)
x.shape
4、将其设置为矩阵
#无论多少数据,生成一列,反之1,-1生成一行
x.shape = -1, 1
y.shape = -1, 1
x.shape
(10, 1)
5、配置多个管道
RidgeCV和Ridge的区别是:前者可以进行交叉验证
将多个管道嵌套,共4个管道Pipeline
看看每个管道做了什么操作
管道1:多形式扩展+线性回归
管道2:多形式扩展+RidgeCV
管道3:多形式扩展+LassoCV
管道4:多形式扩展+ElasticNetCV
目标:比较不同阶数的情况下,会不会出现过拟合的情况
models = [
    Pipeline([
            ('Poly', PolynomialFeatures(include_bias=False)),
            ('Linear', LinearRegression(fit_intercept=False))
        ]),
    Pipeline([
            ('Poly', PolynomialFeatures(include_bias=False)),
            ('Linear', RidgeCV(alphas=np.logspace(-3,2,50), fit_intercept=False))
        ]),
    Pipeline([
            ('Poly', PolynomialFeatures(include_bias=False)),
            ('Linear', LassoCV(alphas=np.logspace(0,1,10), fit_intercept=False))
        ]),
    Pipeline([
            ('Poly', PolynomialFeatures(include_bias=False)),
            ('Linear', ElasticNetCV(alphas=np.logspace(0,1,10)
               , l1_ratio=[.1, .5, .7, .9, .95, 1], fit_intercept=False))
        ])
]
6、使用管道1:多形式扩展+线性回归
model = models[0]
model.set_params(Poly__degree=3)
model.fit(x, y.ravel())
lin = model.get_params()
lin
{'Linear': LinearRegression(copy_X=True, fit_intercept=False, n_jobs=1, normalize=False),
'Linear__copy_X': True,
'Linear__fit_intercept': False,
'Linear__n_jobs': 1,
'Linear__normalize': False,
'Poly': PolynomialFeatures(degree=3, include_bias=False, interaction_only=False),
'Poly__degree': 3,
'Poly__include_bias': False,
'Poly__interaction_only': False,
'memory': None,
'steps': [('Poly',
PolynomialFeatures(degree=3, include_bias=False, interaction_only=False)),
('Linear',
LinearRegression(copy_X=True, fit_intercept=False, n_jobs=1, normalize=False))]}
lin1 = model.set_params(Poly__include_bias = True)
lin1
Pipeline(memory=None,
steps=[('Poly', PolynomialFeatures(degree=3, include_bias=True, interaction_only=False)), ('Linear', LinearRegression(copy_X=True, fit_intercept=False, n_jobs=1, normalize=False))])
7、线性模型过拟合图形识别
## 线性模型过拟合图形识别
plt.figure(facecolor='w')
degree = np.arange(1,N,4) # 阶
dm = degree.size
print('degree=',degree,'dm=',dm)

colors = [] # 颜色
for c in np.linspace(16711680, 255, dm):
    colors.append('#%06x' % int(c))

model = models[0]
for i,d in enumerate(degree):
    print("i=",i,'d=',d)
    ###subplot(m,n,p),m代表行,n代表列
    ## p代表的这个图形画在第几行、第几列
    ## ceil 向上取整
    plt.subplot(int(np.ceil(dm/2.0)),2,i+1)

    ## zorder 表示绘画的顺序,N约小越先画
    plt.plot(x, y, 'ro', ms=10, zorder=N)

    # 设置阶数
    model.set_params(Poly__degree=d)
    # 模型训练
    model.fit(x, y.ravel())

    lin = model.get_params('Linear')['Linear']
    output = u'%d阶,系数为:' % (d)
    print (output, lin.coef_.ravel())

    ## 产生模拟数据
    x_hat = np.linspace(x.min(), x.max(), num=100)
    x_hat.shape = -1,1
    y_hat = model.predict(x_hat)
    s = model.score(x, y)
    ## 模型评分
    print('score=',s,'\n')

    z = N - 1 if (d == 2) else 0
    label = u'%d阶, 正确率=%.3f' % (d,s)
    plt.plot(x_hat, y_hat, color=colors[i],
        lw=2, alpha=0.75, label=label, zorder=N)

    plt.legend(loc = 'upper left')
    plt.grid(True)
    plt.xlabel('X', fontsize=16)
    plt.ylabel('Y', fontsize=16)

plt.tight_layout(1, rect=(0,0,1,0.95))
plt.suptitle(u'线性回归过拟合显示', fontsize=22)
plt.show()
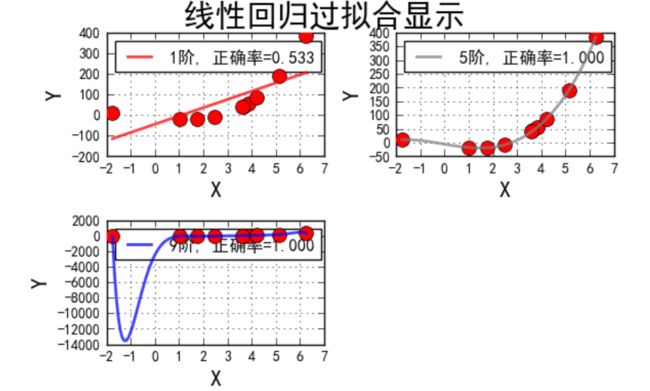
degree= [1 5 9] dm= 3
i= 0 d= 1
1阶,系数为: [-44.14102611 40.05964256]
score= 0.532590275112
i= 1 d= 5
5阶,系数为: [ -5.60899679 -14.80109301 0.75014858 2.11170671 -0.07724668 0.00566633]
score= 0.999984040519
i= 2 d= 9
9阶,系数为: [-2465.58381316 6108.63817712 -5111.99333504 974.74974891 1078.89649478 -829.50277842 266.13230658 -45.71741587 4.1158274 -0.15281063]
score= 1.0
总结:
1阶多项式扩展欠拟合,5阶多项式扩展相对比较优秀,9阶多项式扩展过拟合。
观察9阶多项式扩展的结果,系数都非常大。这是模型过多迎合了异常值造成的结果。
9阶多项式扩展形成的模型很难对测试集上的值进行准确预测。
模型每一个驻点的斜率为0,而当图像慢慢到驻点的过程中,斜率在逐渐变大,而斜率大意味着导数大。如果出现一个异常值斜率非常大,如果这个值的点本身不大(因为数据都做过标准化,普遍不会相差太多),那么要使得斜率大,则系数必然大。只有这样才能保证导数值比较大。
所以,当模型过拟合的时候,一般系数都比较大。
通过这种方式去判断,即使不画图我们也能预测模型是否过拟合。
那么怎么解决这种过拟合的问题?
1、减少特征数。
2、增加正则项、惩罚项。
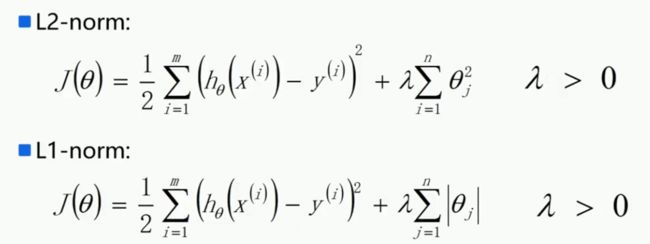
目标函数:
为了防止数据过拟合,也就是θ值在样本空间中不能过大/过小,可以在目标函数之上增加一个平方和损失:
9阶多项式展开后得到的模型虽然拟合度很高,但是将对应的θ值代入J(θ),会发现J(θ)是一个非常大的数,说明损失函数非常大。
我们希望得到一组新的θ值,在评分好的同时,希望损失函数J(θ)相对较小。
在J(θ)中,λ的值越大,损失函数对模型的约束力越好。
损失函数的介绍:06 损失函数、过拟合欠拟合


