QT读取csv文件并且绘制折线图
void MainWindow::readcsvfile() //读取csv
{
QFile csvFile("C:/Users/Administrator/Desktop/Demo/0702.CSV");
QStringList csvList;
csvList.clear();
if (csvFile.open(QIODevice::ReadWrite)) //对csv文件进行读写操作
{
QTextStream stream(&csvFile);
while (!stream.atEnd())
{
csvList.push_back(stream.readLine()); //保存到List当中
}
csvFile.close();
}
else
{
QMessageBox::about(NULL, "csv文件", "未打开该文件!");
}
int i = 0;
Q_FOREACH(QString str, csvList) //遍历List
{
i = i + 1;
QStringList valsplit = str.split(","); //分隔字符串
if(i > 2)
{
//得到深度、声速、温度
QString depth = valsplit[0];
QString sonicvelocity = valsplit[1];
QString temperature = valsplit[2];
double depthvalue = depth.toDouble();
double sonicvalue = sonicvelocity.toDouble();
double tempvalue = temperature.toDouble();
//Q//MessageBox::warning(NULL, "dd", QString::number(tempvalue));
QPointF point;
point.setX(depthvalue);
point.setY(sonicvalue);
QPointF point2;
point2.setX(depthvalue);
point2.setY(tempvalue + 1510);
vectors.append(point);
vector2.append(point2);
}
}
}
void MainWindow::lineChart() //绘制图
{
//设置X,Y标题
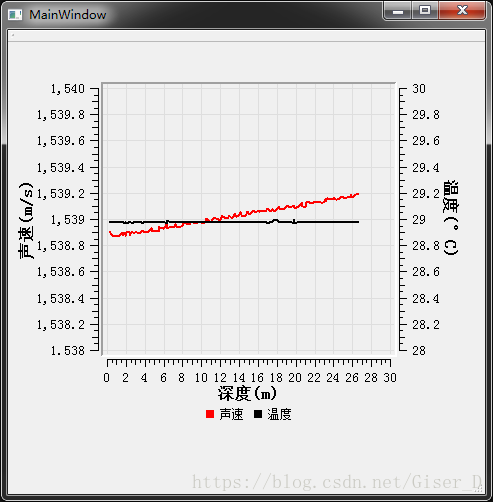
ui->qwtPlot->setAxisTitle(QwtPlot::xBottom, QString::fromLocal8Bit("深度(m)"));
ui->qwtPlot->setAxisTitle(QwtPlot::yLeft, QString::fromLocal8Bit("声速(m/s)"));
ui->qwtPlot->setAxisTitle(QwtPlot::yRight, QString::fromLocal8Bit("温度(°C)"));
ui->qwtPlot->enableAxis(QwtPlot::yRight,true);
ui->qwtPlot->setAxisScale(QwtPlot::yLeft,1538,1540,0.2);
ui->qwtPlot->setAxisScale(QwtPlot::xBottom,0,30,2);
ui->qwtPlot->setAxisScale(QwtPlot::yRight,28,30,0.2);
//ui->qwtPlot->set
//构造曲线数据
QwtPointSeriesData* series = new QwtPointSeriesData(vectors);
//设置网格
QwtPlotGrid* grid = new QwtPlotGrid();
grid->setPen(QColor(222, 222, 222), 1);
grid->attach(ui->qwtPlot);
//create plot item
QwtPlotCurve* curve1 = new QwtPlotCurve(QString::fromLocal8Bit("声速"));
//设置数据
curve1->setData(series);
//设置画笔颜色==就是图像颜色
curve1->setPen(QColor(255, 0, 0), 2, Qt::SolidLine);
//使曲线更光滑
curve1->setCurveAttribute(QwtPlotCurve::Fitted, true);
//把曲线附加到qwtPlot上
curve1->attach(ui->qwtPlot);
//添加温度-深度曲线
//构造曲线数据
QwtPointSeriesData* series2 = new QwtPointSeriesData(vector2);
//create plot item
QwtPlotCurve* curve2 = new QwtPlotCurve(QString::fromLocal8Bit("温度"));
//设置数据
curve2->setData(series2);
//设置画笔颜色=图像颜色
curve2->setPen(QColor(127, 222, 335), 2, Qt::SolidLine);
//使曲线更光滑
curve2->setCurveAttribute(QwtPlotCurve::Fitted, true);
//把曲线附加到qwtPlot上
curve2->attach(ui->qwtPlot);
//设置图例
QwtLegend *legend = new QwtLegend;
legend->setDefaultItemMode(QwtLegendData::ReadOnly);
ui->qwtPlot->insertLegend(legend,QwtPlot::BottomLegend);//插入图例
ui->qwtPlot->replot();
ui->qwtPlot->show();
}需要第三方库QWT
运行结果: